Taboola Investor Presentation Deck slide image

Taboola Investor Presentation Deck

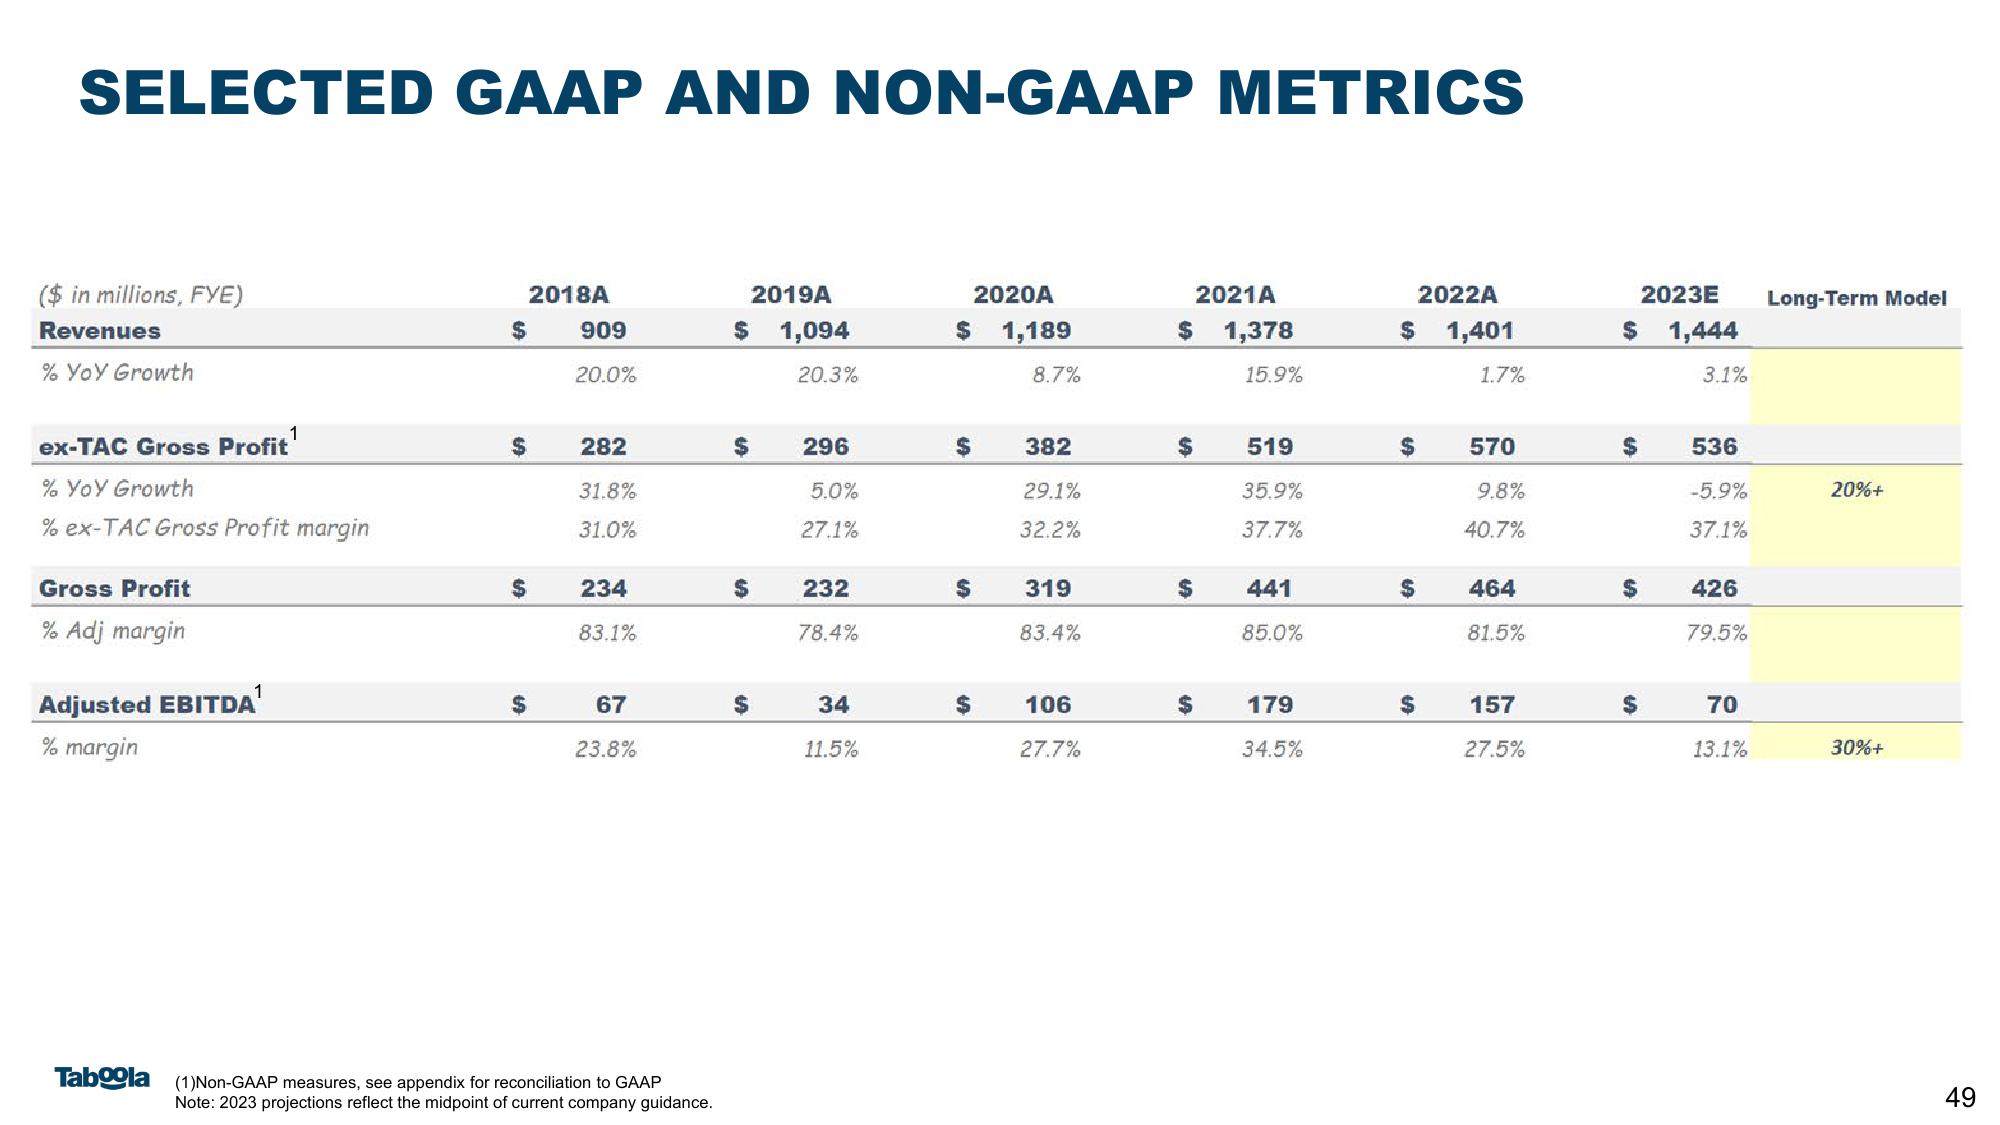
SELECTED GAAP AND NON-GAAP METRICS ($ in millions, FYE) Revenues % YoY Growth ex-TAC Gross Profit¹ % YoY Growth % ex-TAC Gross Profit margin Gross Profit % Adj margin Adjusted EBITDA¹ % margin $ $ $ 2018A 909 20.0% 282 31.8% 31.0% 234 83.1% 67 23.8% Taboola (1)Non-GAAP measures, see appendix for reconciliation to GAAP Note: 2023 projections reflect the midpoint of current company guidance. 2019A $ 1,094 20.3% $ 296 5.0% 27.1% 232 78.4% 34 11.5% $ $ $ 2020A 1,189 8.7% 382 29.1% 32.2% 319 83.4% 106 27.7% 2021A $ 1,378 15.9% 519 35.9% 37.7% 441 85.0% 179 34.5% 2022A $ 1,401 $ $ $ 1.7% 570 9.8% 40.7% 464 81.5% 157 27.5% $ $ $ $ 2023E 1,444 3.1% 536 -5.9% 37.1% 426 79.5% 70 13.1% Long-Term Model 20%+ 30%+ 49
View entire presentation