Bridge Investment Group Results Presentation Deck
Appendix
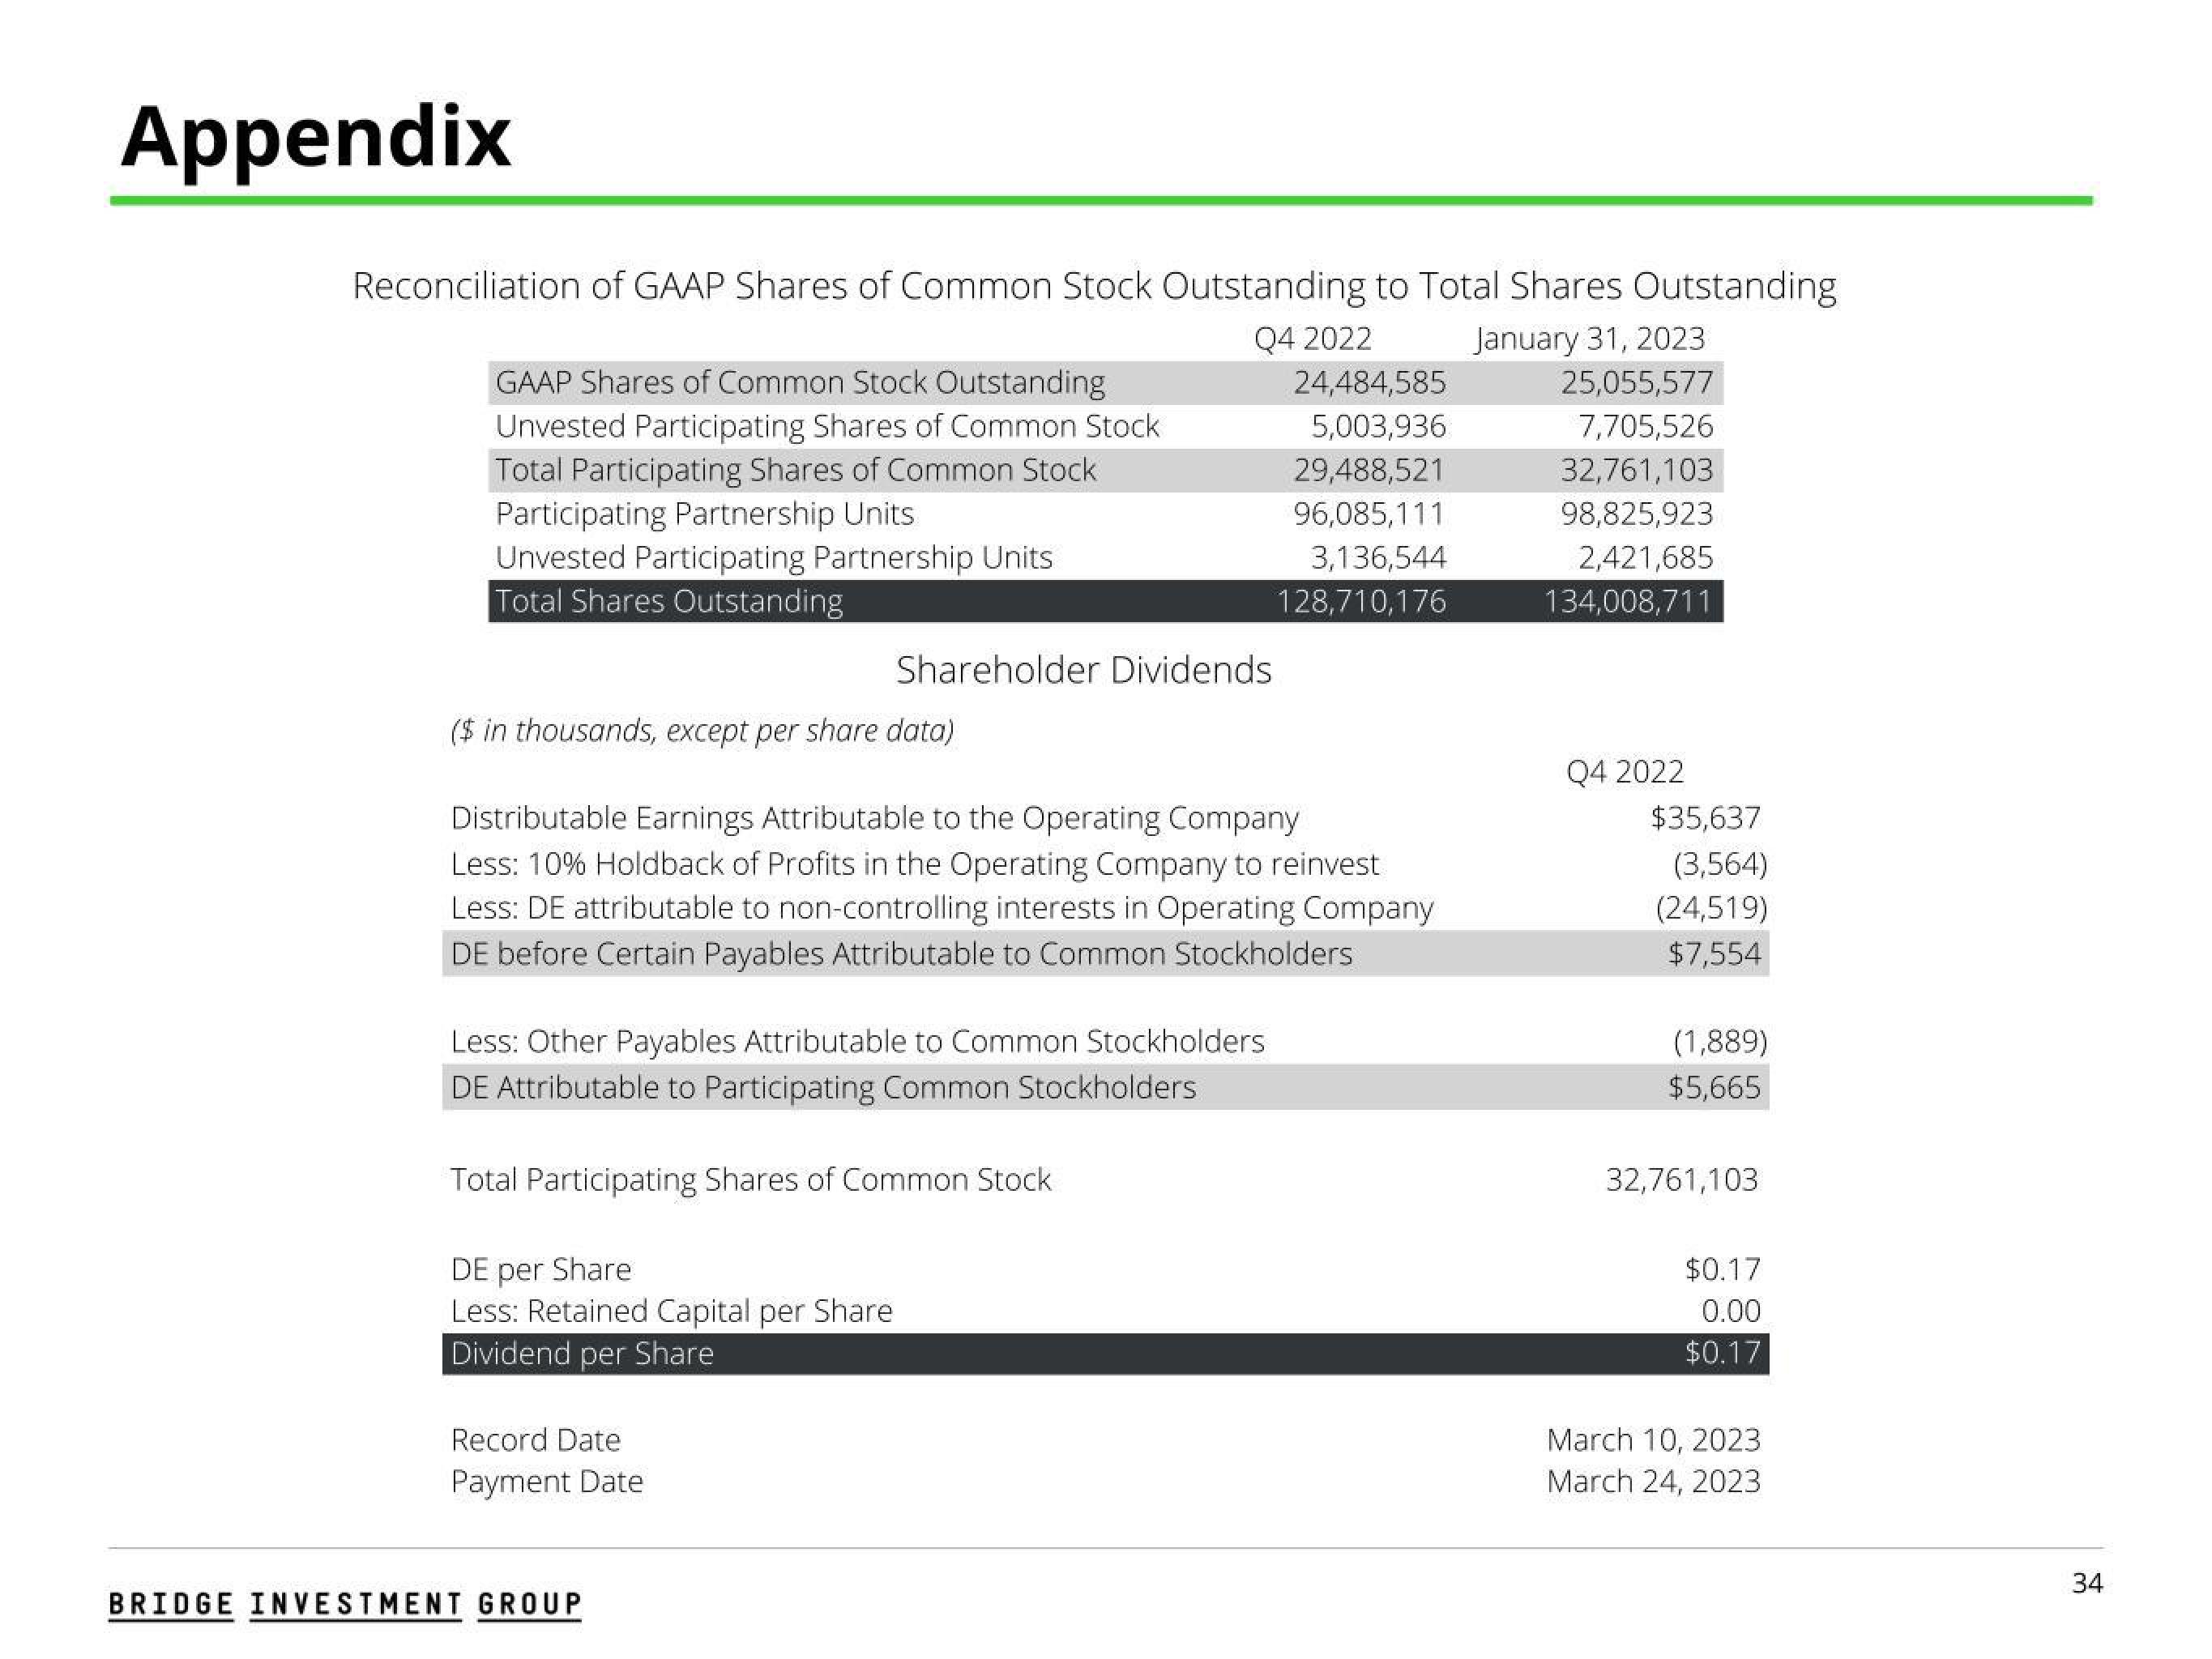
Reconciliation of GAAP Shares of Common Stock Outstanding to Total Shares Outstanding
Q4 2022
GAAP Shares of Common Stock Outstanding
Unvested Participating Shares of Common Stock
Total Participating Shares of Common Stock
Participating Partnership Units
Unvested Participating Partnership Units
Total Shares Outstanding
Shareholder Dividends
($ in thousands, except per share data)
Distributable Earnings Attributable to the Operating Company
Less: 10% Holdback of Profits in the Operating Company to reinvest
Less: DE attributable to non-controlling interests in Operating Company
DE before Certain Payables Attributable to Common Stockholders
Less: Other Payables Attributable to Common Stockholders
DE Attributable to Participating Common Stockholders
Total Participating Shares of Common Stock
DE per Share
Less: Retained Capital per Share
Dividend per Share
Record Date
Payment Date
BRIDGE INVESTMENT GROUP
24,484,585
5,003,936
29,488,521
96,085,111
3,136,544
128,710,176
January 31, 2023
25,055,577
7,705,526
32,761,103
98,825,923
2,421,685
134,008,711
Q4 2022
$35,637
(3,564)
(24,519)
$7,554
(1,889)
$5,665
32,761,103
$0.17
0.00
$0.17
March 10, 2023
March 24, 2023
34View entire presentation