First Merchants Results Presentation Deck
Highlights
Fourth Quarter
Net Income & EPS¹
ROA (Annualized)
$42.0 Million
0.92% ROA
$0.71 Per Share
1.33% PTPP ROA²
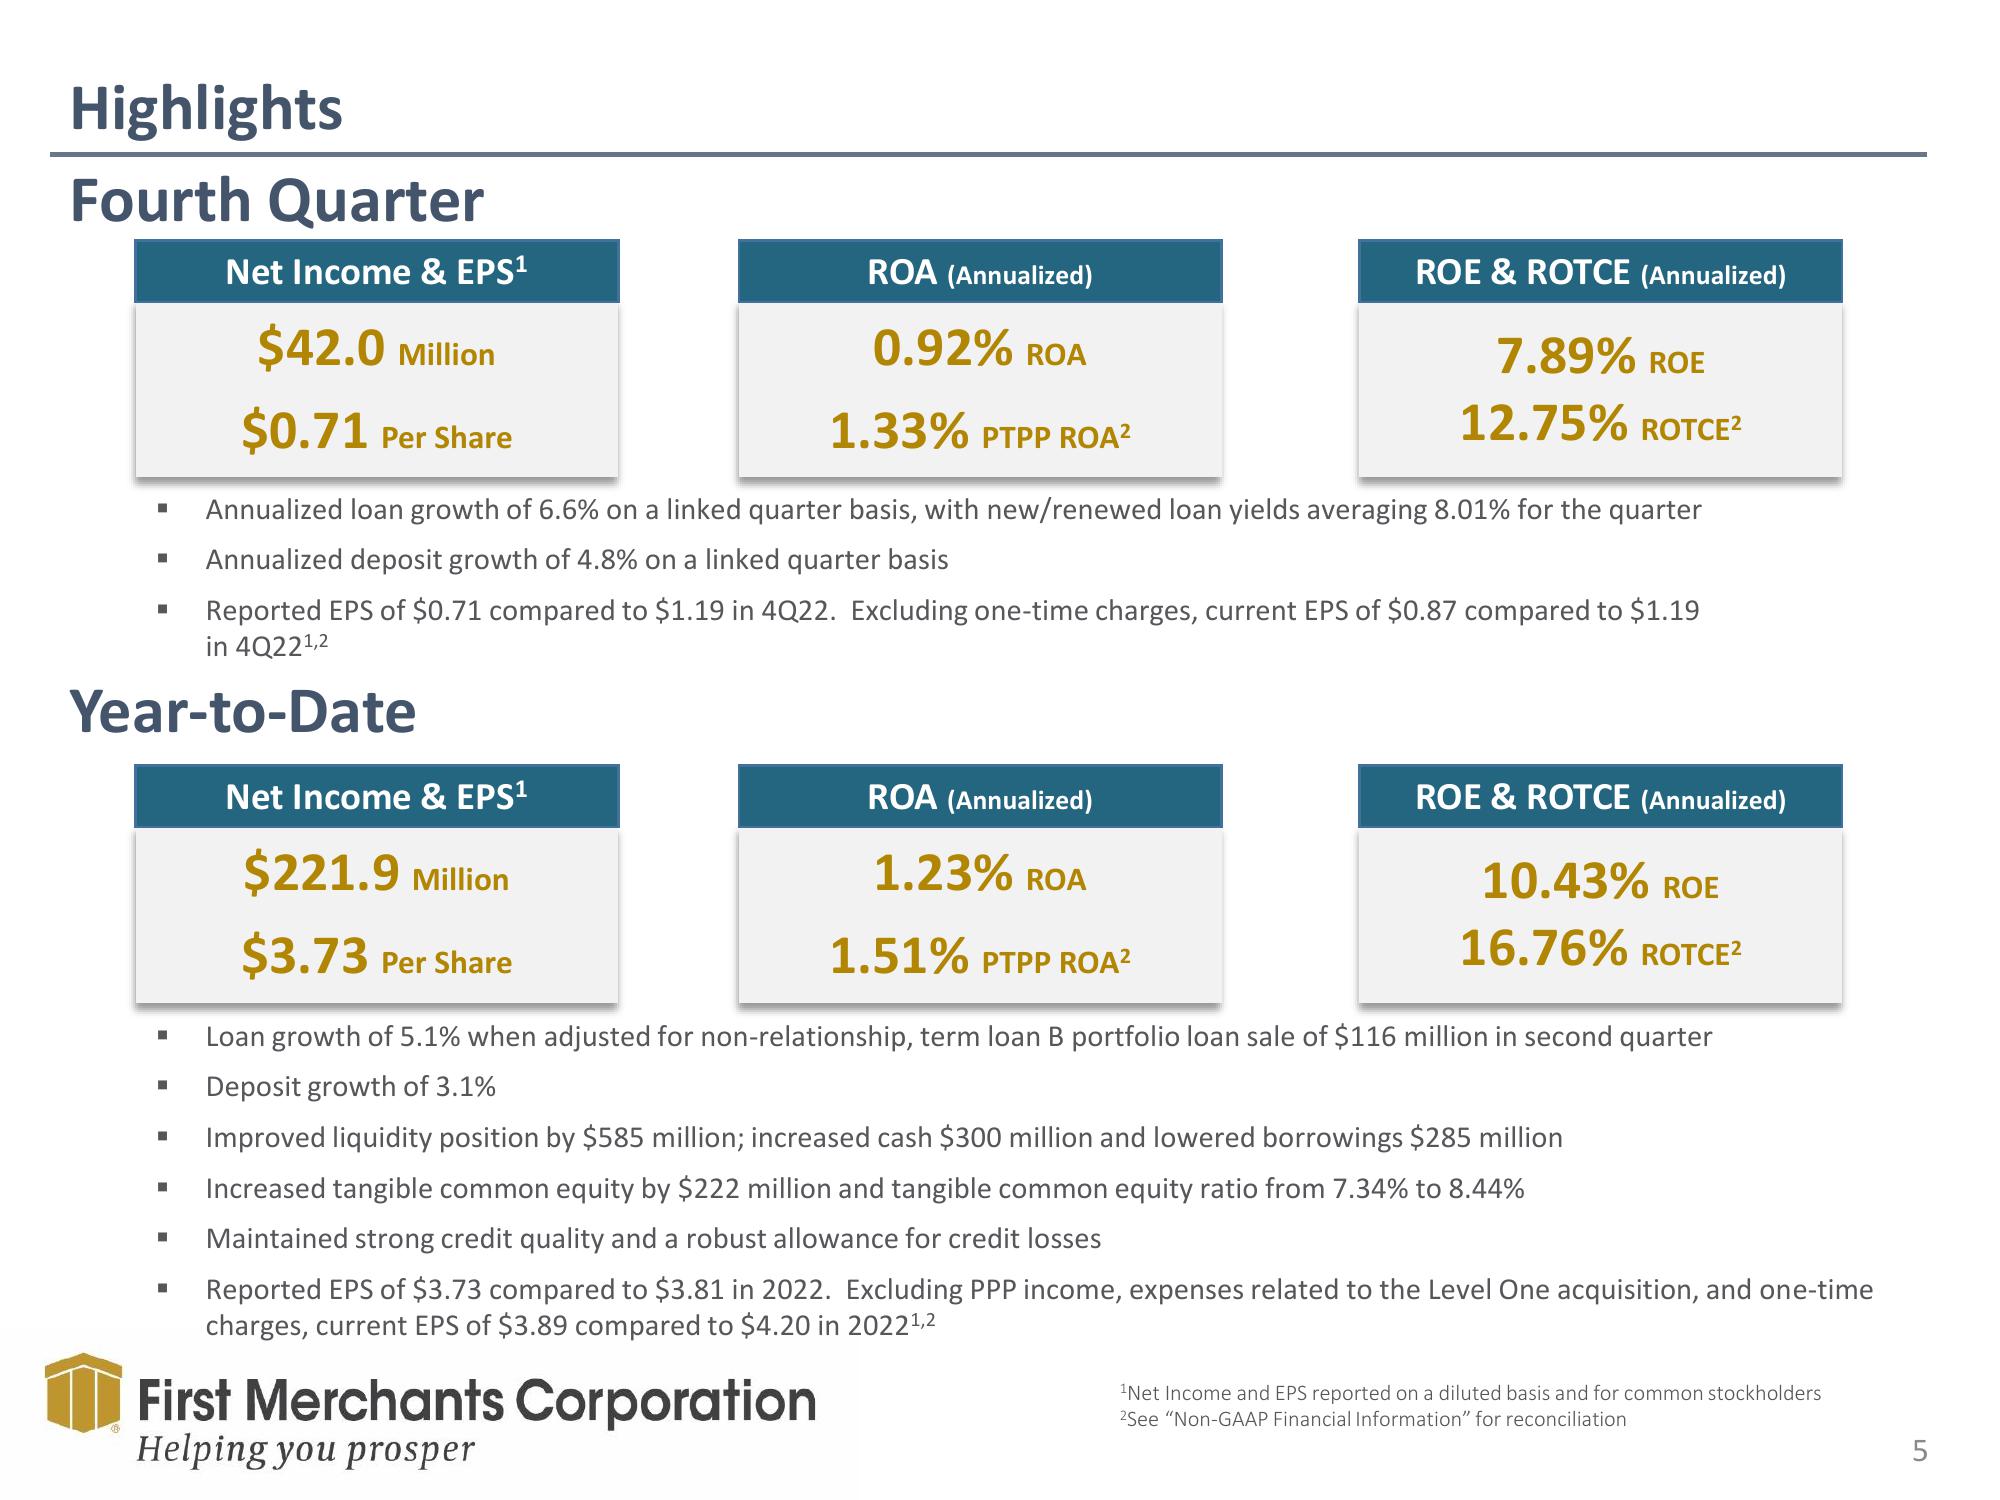
Annualized loan growth of 6.6% on a linked quarter basis, with new/renewed loan yields averaging 8.01% for the quarter
Annualized deposit growth of 4.8% on a linked quarter basis
Reported EPS of $0.71 compared to $1.19 in 4Q22. Excluding one-time charges, current EPS of $0.87 compared to $1.19
in 4Q22¹,2
Year-to-Date
I
■
■
■
■
■
■
■
Net Income & EPS¹
$221.9 Million
$3.73 Per Share
ROA (Annualized)
1.23% ROA
First Merchants Corporation
Helping you prosper
ROE & ROTCE (Annualized)
7.89% ROE
12.75% ROTCE²
ROE & ROTCE (Annualized)
10.43% ROE
16.76% ROTCE²
1.51% PTPP ROA²
Loan growth of 5.1% when adjusted for non-relationship, term loan B portfolio loan sale of $116 million in second quarter
Deposit growth of 3.1%
Improved liquidity position by $585 million; increased cash $300 million and lowered borrowings $285 million
Increased tangible common equity by $222 million and tangible common equity ratio from 7.34% to 8.44%
Maintained strong credit quality and a robust allowance for credit losses
Reported EPS of $3.73 compared to $3.81 in 2022. Excluding PPP income, expenses related to the Level One acquisition, and one-time
charges, current EPS of $3.89 compared to $4.20 in 2022¹,2
¹Net Income and EPS reported on a diluted basis and for common stockholders
2See "Non-GAAP Financial Information" for reconciliationView entire presentation