Oatly Results Presentation Deck
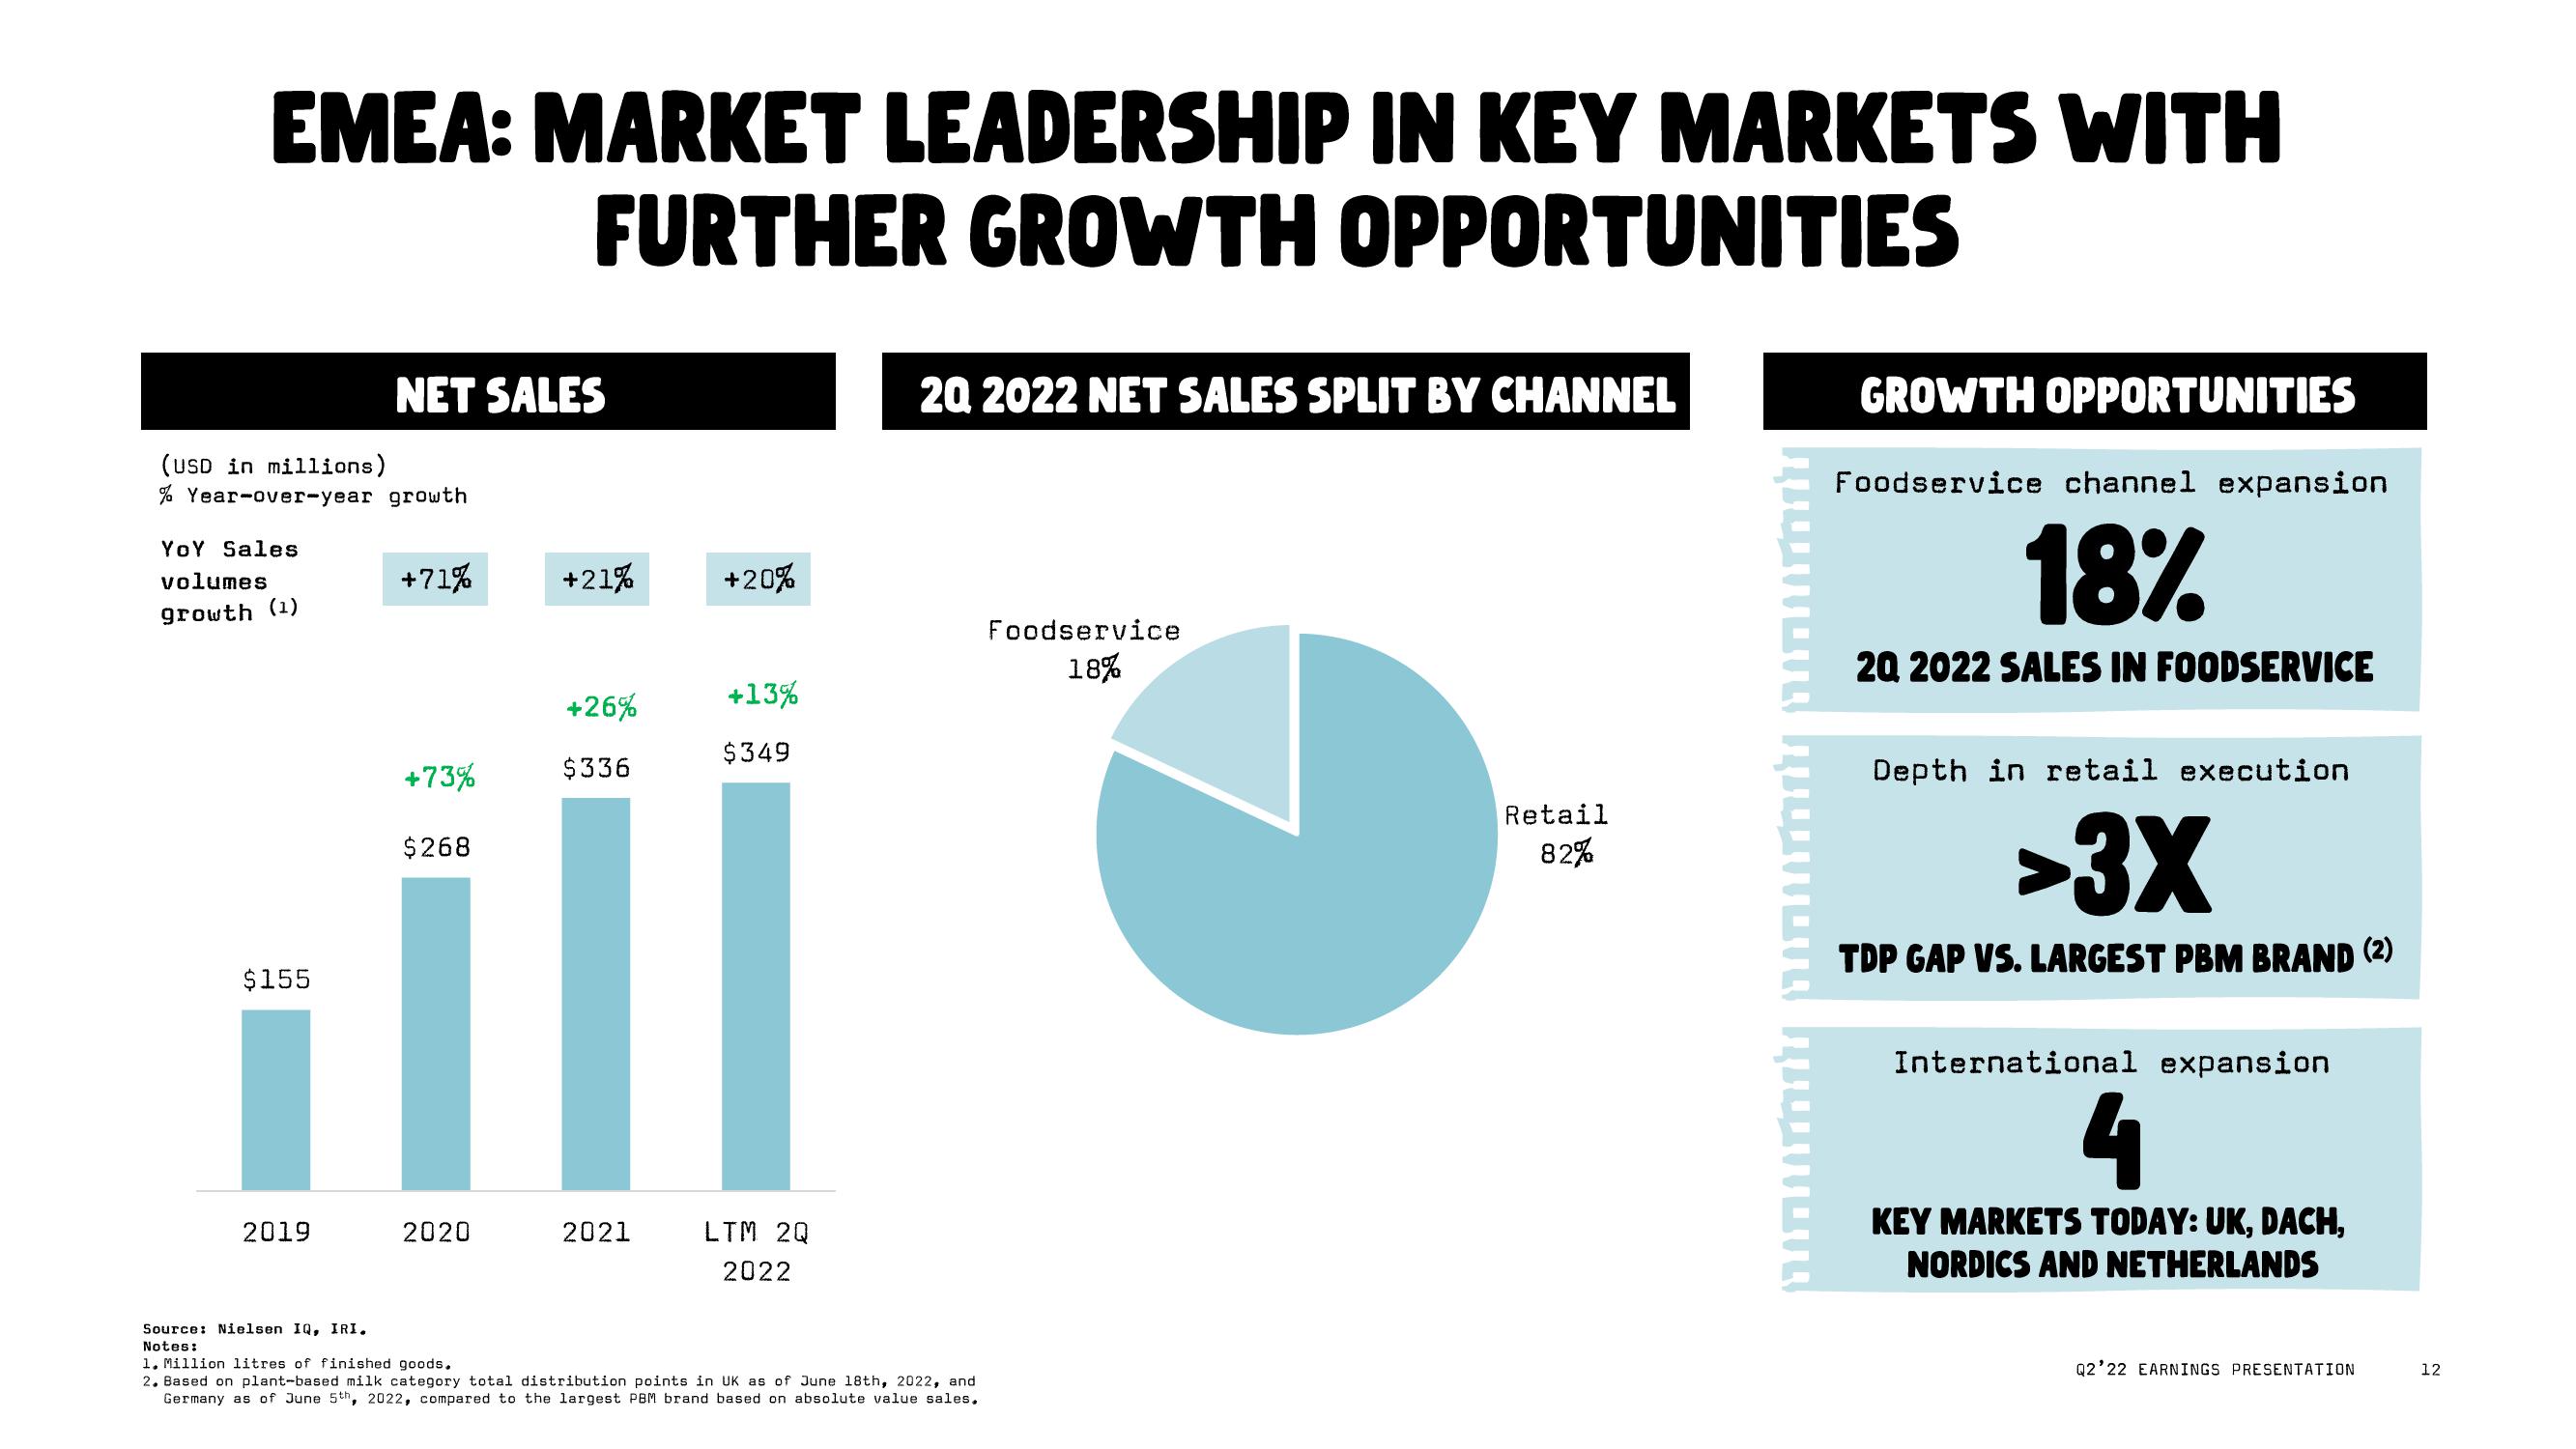
EMEA: MARKET LEADERSHIP IN KEY MARKETS WITH
FURTHER GROWTH OPPORTUNITIES
(USD in millions)
% Year-over-year growth
YOY Sales
volumes
growth (1)
$155
2019
NET SALES
Source: Nielsen IQ, IRI.
Notes:
+71%
+73%
$268
2020
+21%
+26%
$336
2021
+20%
+13%
$349
LTM 2Q
2022
20 2022 NET SALES SPLIT BY CHANNEL
1. Million litres of finished goods.
2. Based on plant-based milk category total distribution points in UK as of June 18th, 2022, and
Germany as of June 5th, 2022, compared to the largest PBM brand based on absolute value sales.
Foodservice
18%
Retail
82%
GROWTH OPPORTUNITIES
Foodservice channel expansion
18%
20 2022 SALES IN FOODSERVICE
Depth in retail execution
>3X
TDP GAP VS. LARGEST PBM BRAND (2)
International expansion
4
KEY MARKETS TODAY: UK, DACH,
NORDICS AND NETHERLANDS
Q2'22 EARNINGS PRESENTATION
12View entire presentation