Melrose Results Presentation Deck
Summary of results
Melrose
Continuing operations
Revenue
Operating profit/(loss)
Profit/(loss) after tax
Diluted earnings per share
Free cash flow²
Net Debt
I
Adjusted¹ results
2020
£m
9,361
340
120
2.4p
Buy
Improve
Sell
628
2,847
2019
£m
11,592
1,102
699
14.3p
591
3,283
1.
Described in the glossary to the 2020 Preliminary Announcement, released on 4 March 2021
2. Adjusted free cash flow in the year excludes restructuring and cash used in discontinued operations
Statutory results
2020
£m
8,770
(338)
(523)
(10.8)p
n/a
n/a
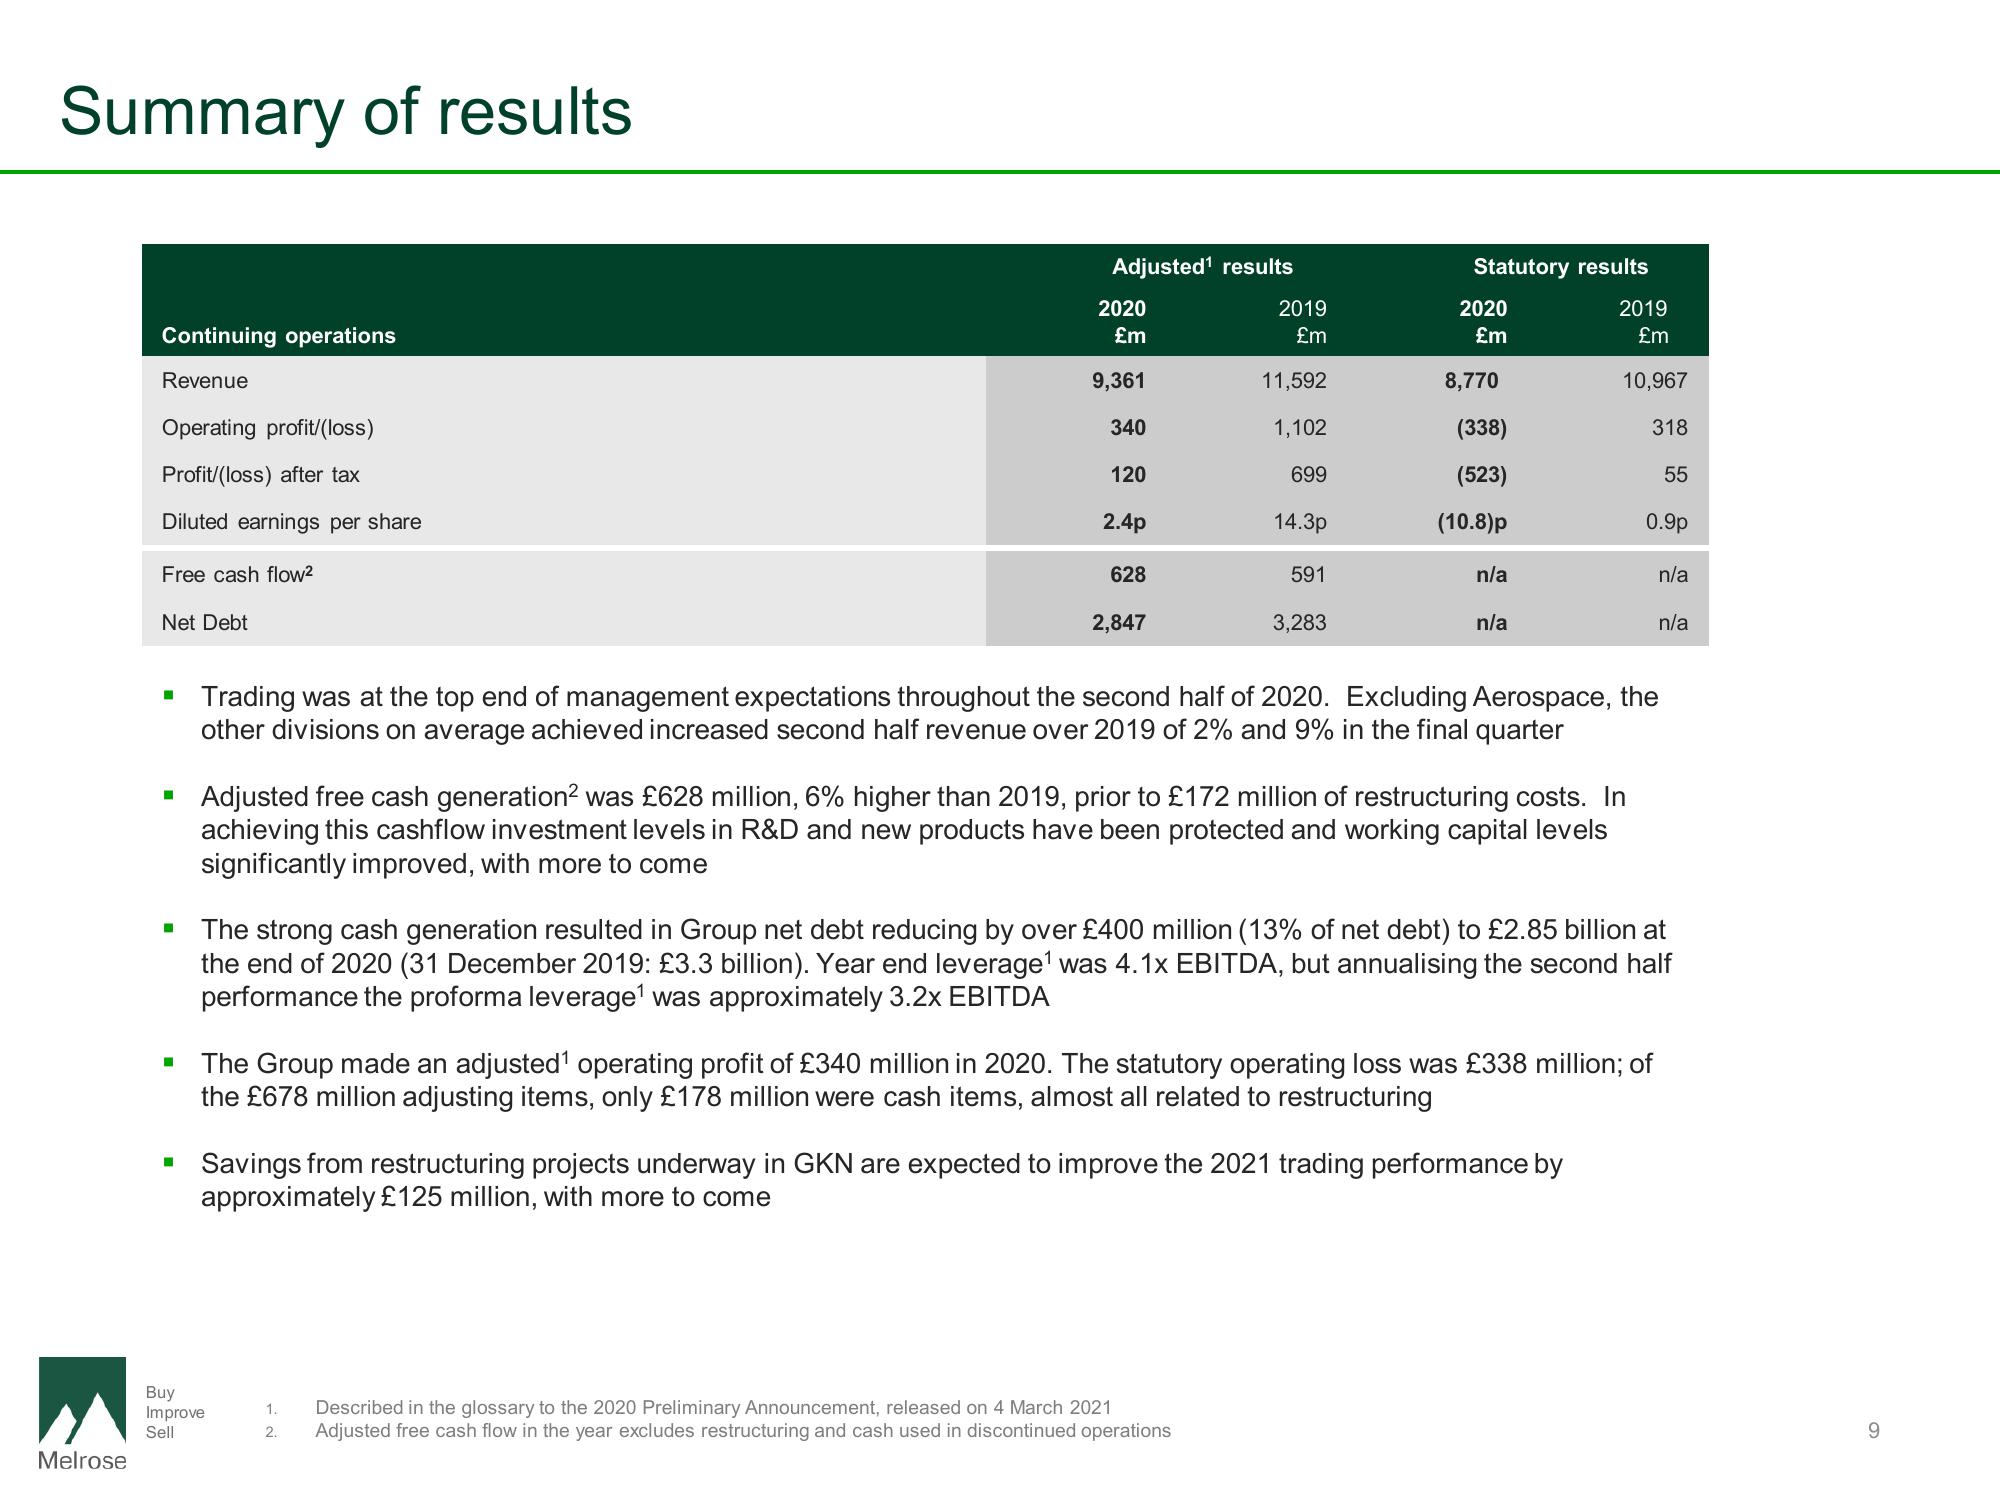
Adjusted free cash generation² was £628 million, 6% higher than 2019, prior to £172 million of restructuring costs. In
achieving this cashflow investment levels in R&D and new products have been protected and working capital levels
significantly improved, with more to come
2019
£m
10,967
318
Trading was at the top end of management expectations throughout the second half of 2020. Excluding Aerospace, the
other divisions on average achieved increased second half revenue over 2019 of 2% and 9% in the final quarter
▪ Savings from restructuring projects underway in GKN are expected to improve the 2021 trading performance by
approximately £125 million, with more to come
The Group made an adjusted¹ operating profit of £340 million in 2020. The statutory operating loss was £338 million; of
the £678 million adjusting items, only £178 million were cash items, almost all related to restructuring
0.9p
55
The strong cash generation resulted in Group net debt reducing by over £400 million (13% of net debt) to £2.85 billion at
the end of 2020 (31 December 2019: £3.3 billion). Year end leverage¹ was 4.1x EBITDA, but annualising the second half
performance the proforma leverage¹ was approximately 3.2x EBITDA
n/a
n/a
9View entire presentation