Vivid Seats SPAC Presentation Deck
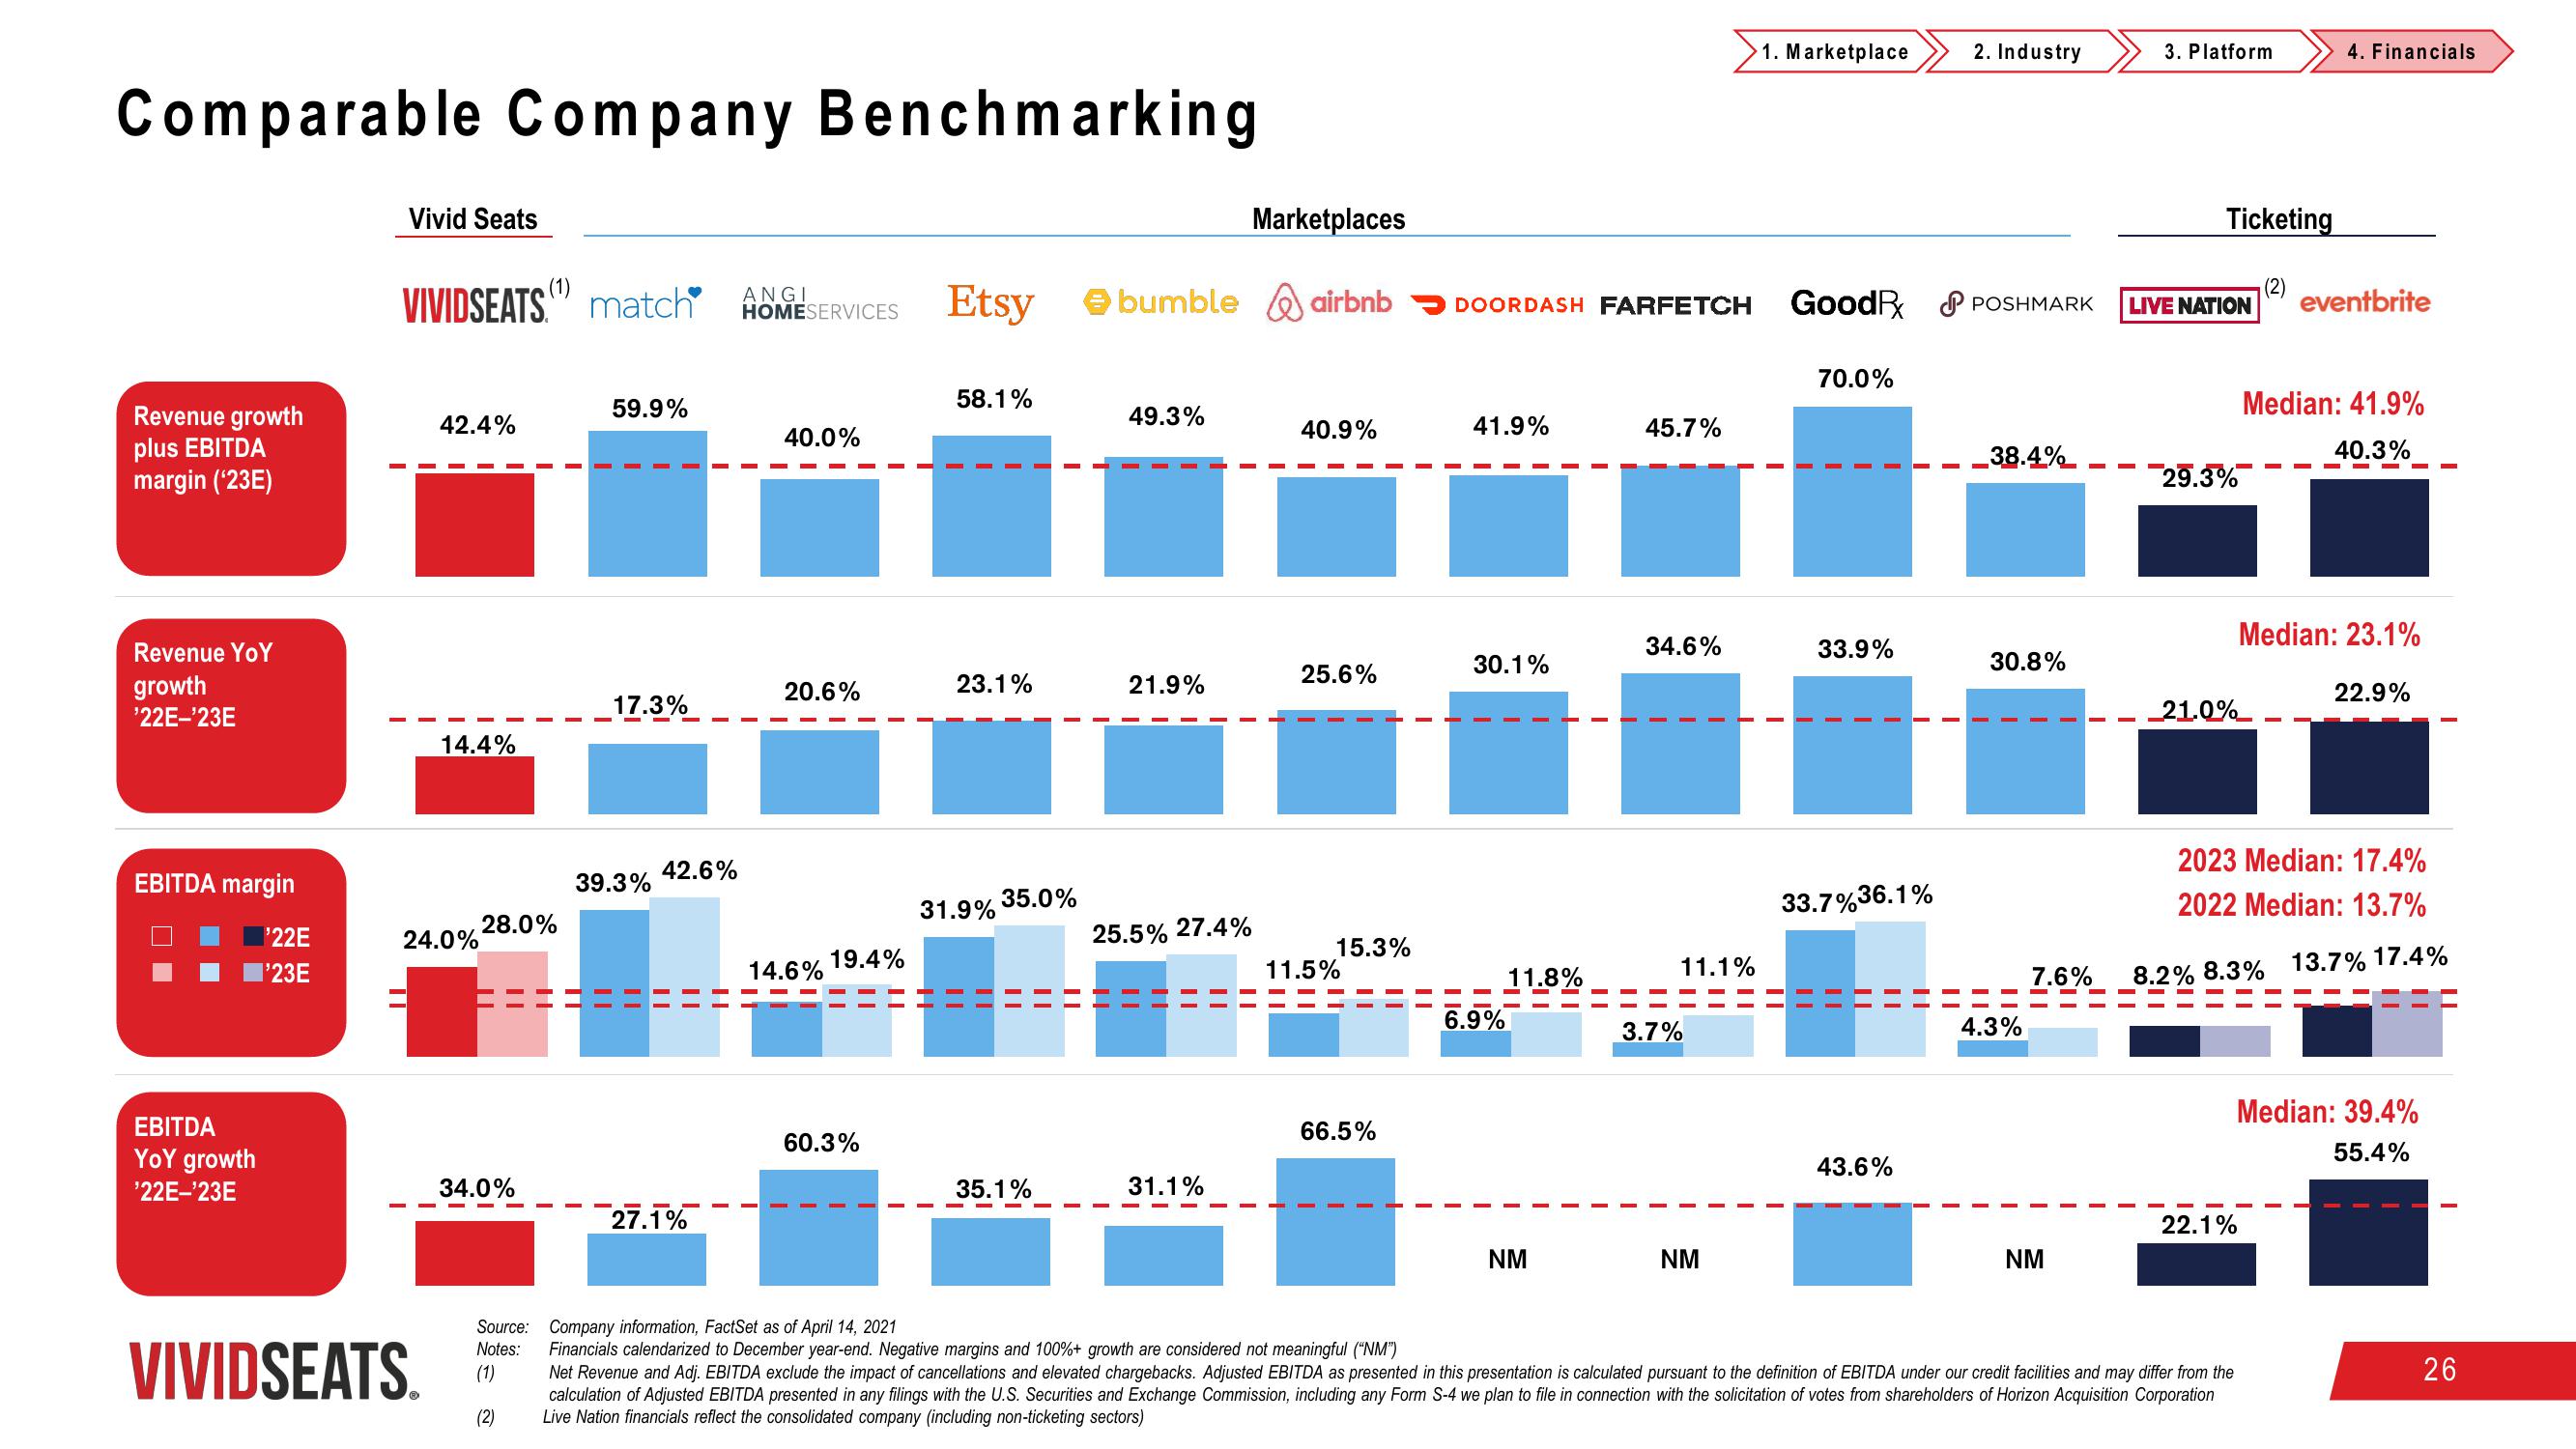
Comparable Company Benchmarking
Revenue growth
plus EBITDA
margin ('23E)
Revenue YoY
growth
¹22E-'23E
EBITDA margin
EBITDA
YoY growth
¹22E-'23E
'22E
I'23E
Vivid Seats
VIVIDSEATS match
42.4%
VIVIDSEATS.
14.4%
24.0%
28.0%
(1)
34.0%
Source:
Notes:
(1)
(2)
59.9%
17.3%
39.3%
42.6%
27.1%
ANGI
HOMESERVICES
40.0%
20.6%
14.6%
19.4%
60.3%
Marketplaces
Etsy bumble airbnb
58.1%
23.1%
31.9%
35.0%
35.1%
49.3%
21.9%
25.5% 27.4%
31.1%
40.9%
25.6%
15.3%
11.5%
66.5%
41.9%
DOORDASH FARFETCH Good POSHMARK
30.1%
6.9%
11.8%
NM
45.7%
34.6%
11.1%
3.7%
1. Marketplace
NM
70.0%
33.9%
33.7%36.1%
2. Industry
43.6%
38.4%
30.8%
4.3%
7.6%
NM
3. Platform
Ticketing
LIVE NATION
-
29.3%
_21.0%.
4. Financials
eventbrite
Median: 41.9%
40.3%
22.1%
Company information, FactSet as of April 14, 2021
Financials calendarized to December year-end. Negative margins and 100% + growth are considered not meaningful ("NM")
Net Revenue and Adj. EBITDA exclude the impact of cancellations and elevated chargebacks. Adjusted EBITDA as presented in this presentation is calculated pursuant to the definition of EBITDA under our credit facilities and may differ from the
calculation of Adjusted EBITDA presented in any filings with the U.S. Securities and Exchange Commission, including any Form S-4 we plan to file in connection with the solicitation of votes from shareholders of Horizon Acquisition Corporation
Live Nation financials reflect the consolidated company (including non-ticketing sectors)
Median: 23.1%
22.9%
2023 Median: 17.4%
2022 Median: 13.7%
8.2% 8.3% 13.7% 17.4%
Median: 39.4%
55.4%
26View entire presentation