OpenText Investor Presentation Deck
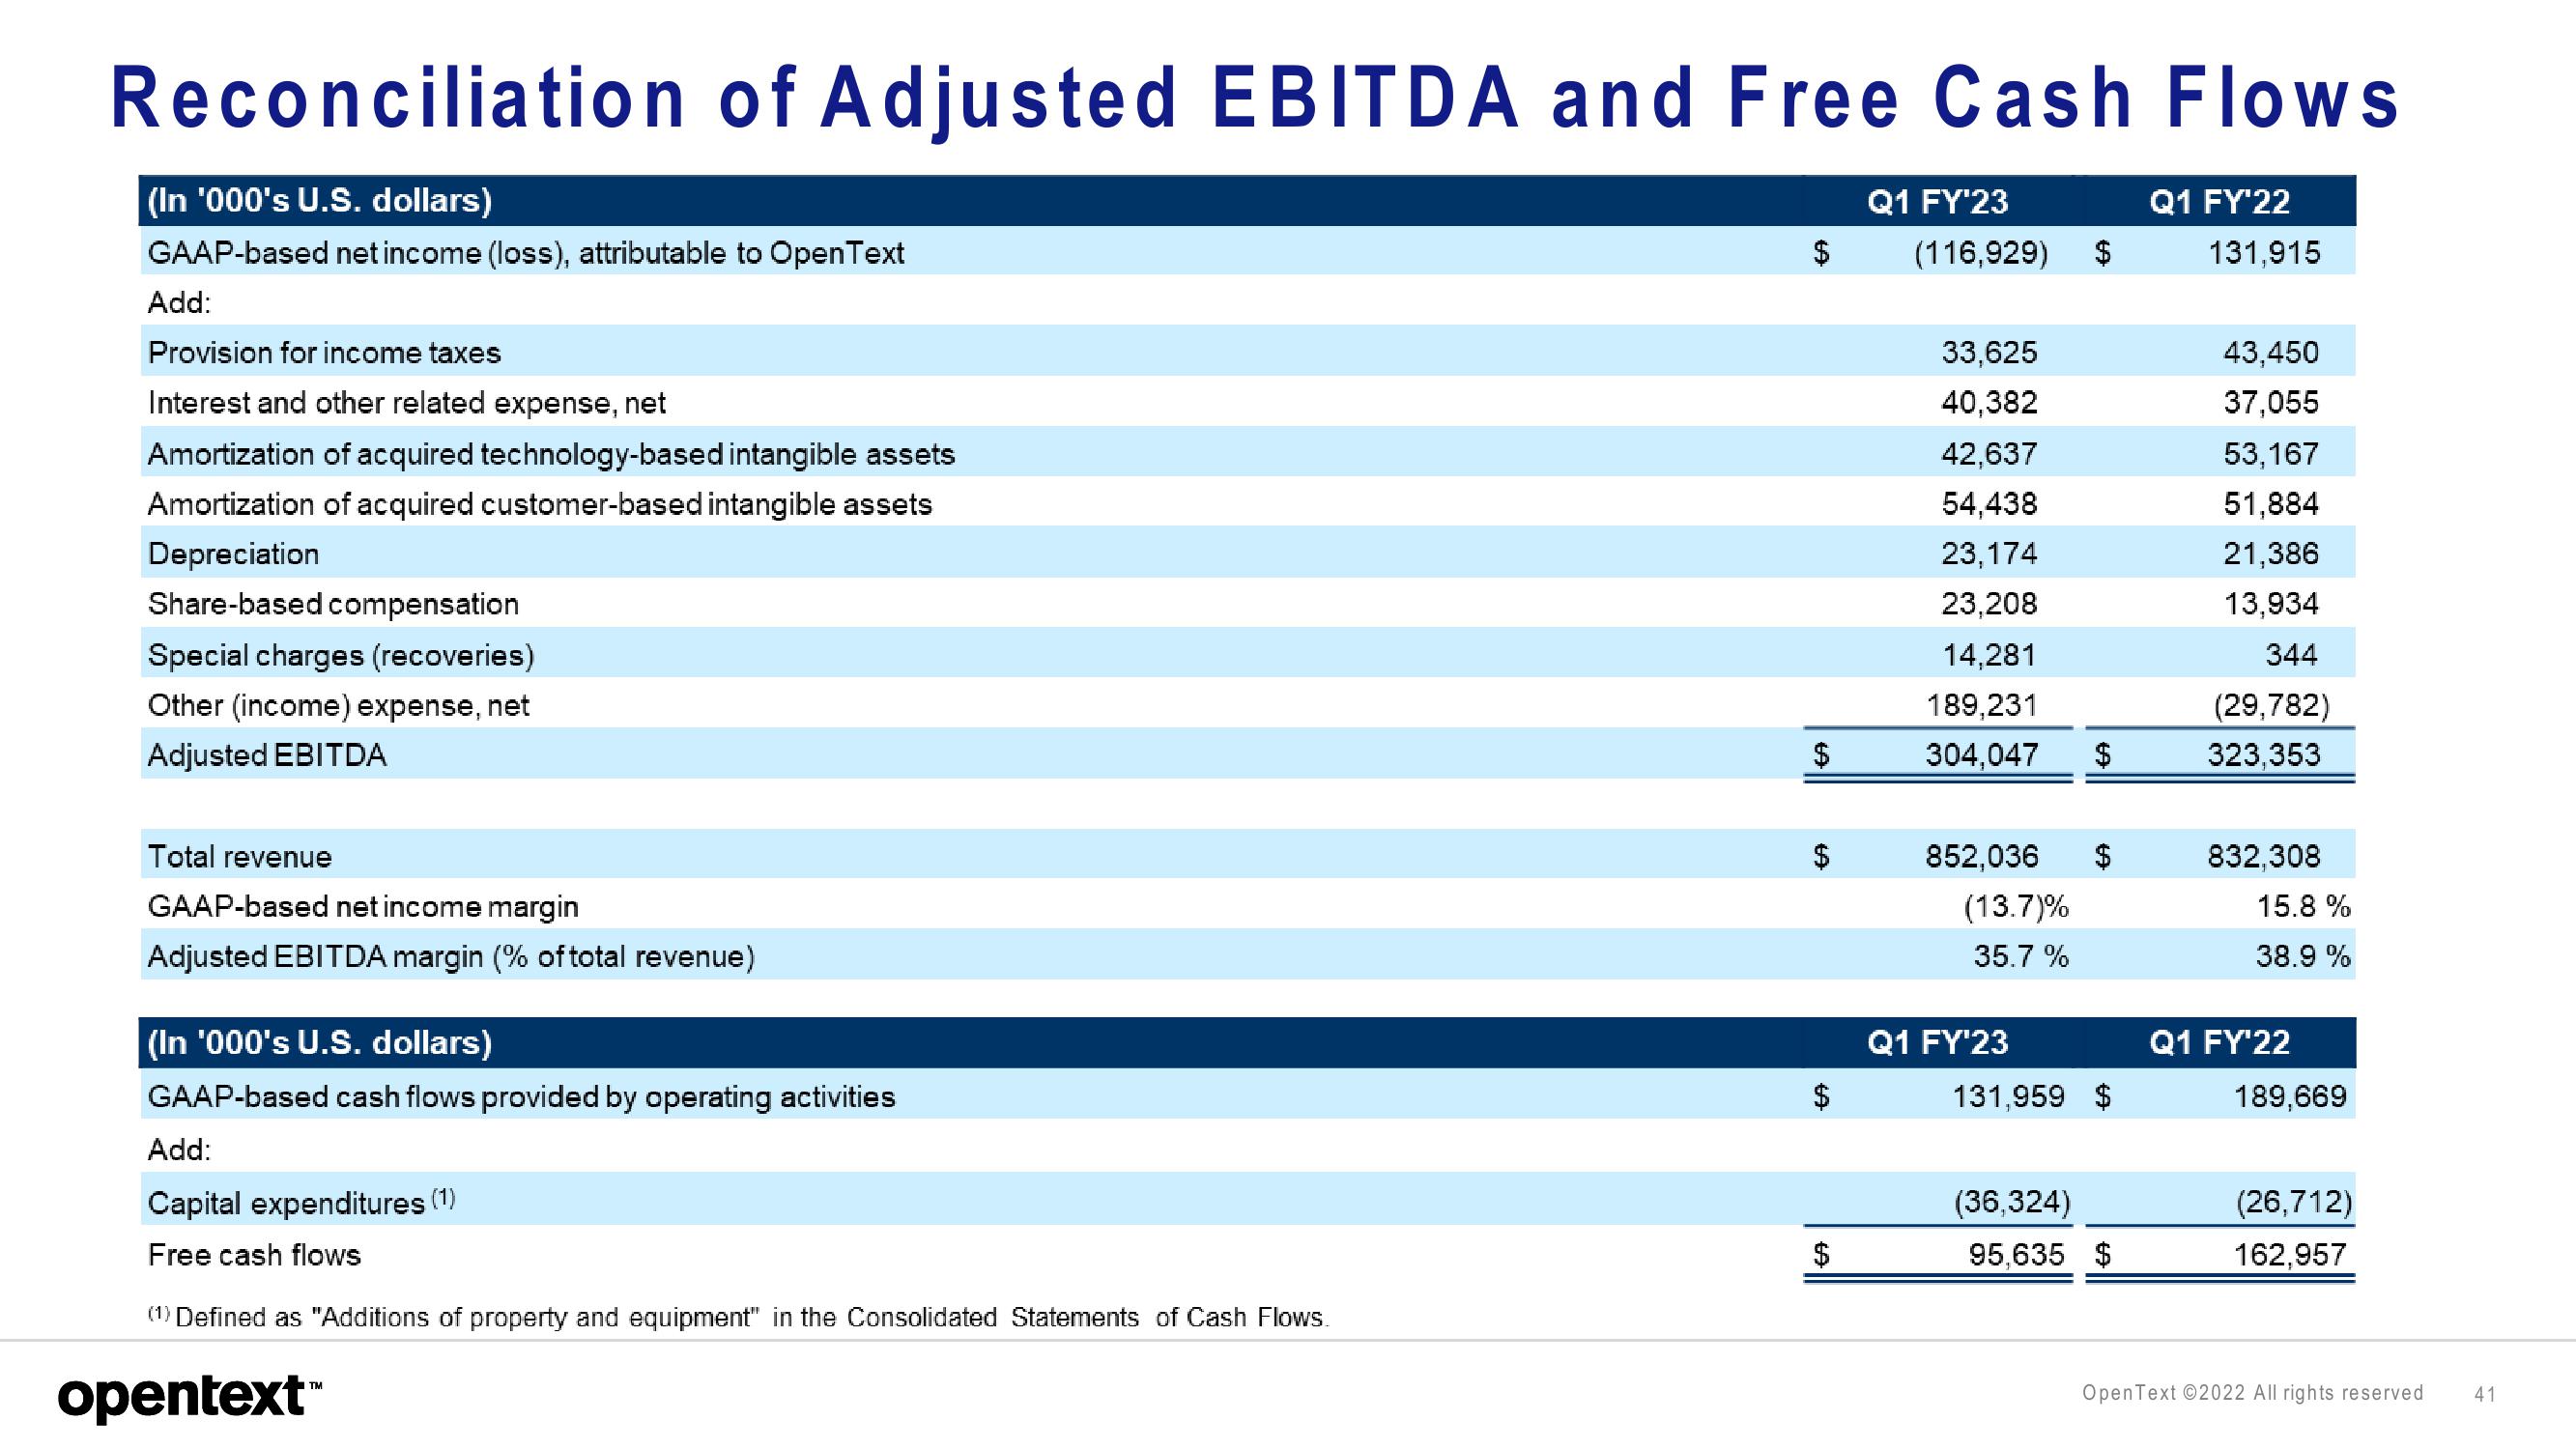
Reconciliation of Adjusted EBITDA and Free Cash Flows
(In '000's U.S. dollars)
GAAP-based net income (loss), attributable to OpenText
Add:
Provision for income taxes
Interest and other related expense, net
Amortization of acquired technology-based intangible assets
Amortization of acquired customer-based intangible assets
Depreciation
Share-based compensation
Special charges (recoveries)
Other (income) expense, net
Adjusted EBITDA
Total revenue
GAAP-based net income margin
Adjusted EBITDA margin (% of total revenue)
(In '000's U.S. dollars)
GAAP-based cash flows provided by operating activities
Add:
Capital expenditures (1)
Free cash flows
(1) Defined as "Additions of property and equipment" in the Consolidated Statements of Cash Flows.
opentext™
$
(A
GA
$
Q1 FY¹23
(116,929) $
33,625
40,382
42,637
54,438
23,174
23,208
14,281
189,231
304,047
852,036
(13.7)%
35.7%
Q1 FY'23
$
131,959 $
(36,324)
95,635 $
Q1 FY'22
131,915
43,450
37,055
53,167
51,884
21,386
13,934
344
(29,782)
323,353
832,308
15.8 %
38.9%
Q1 FY'22
189,669
(26,712)
162,957
OpenText ©2022 All rights reserved
41View entire presentation