Paysafe Results Presentation Deck
Continued focus on reducing leverage
6/30/23
$305
(28)
207
$484
Liquidity position ($m)
Committed RCF(¹)
Amounts drawn
Cash and cash equivalents
Total
Facility (as of 6/30/23) ($m)
Fixed rate SSN
Interest rate swap (notional)
Total fixed (excl. digital wallet deposits)
Natural hedge from interest earning deposits in digital wallet
Total fixed (incl. digital wallet deposits)
Total floating
Total Debt(¹)
Net Debt (¹)
Net Debt-to-LTM Adj. EBITDA (2)
Paysafe:
$805
$337
$1,142
$773
$1,915
$661
$2,576
$2,369
5.6X
%
total
~44%
~74%
~26%
100%
●
●
●
●
●
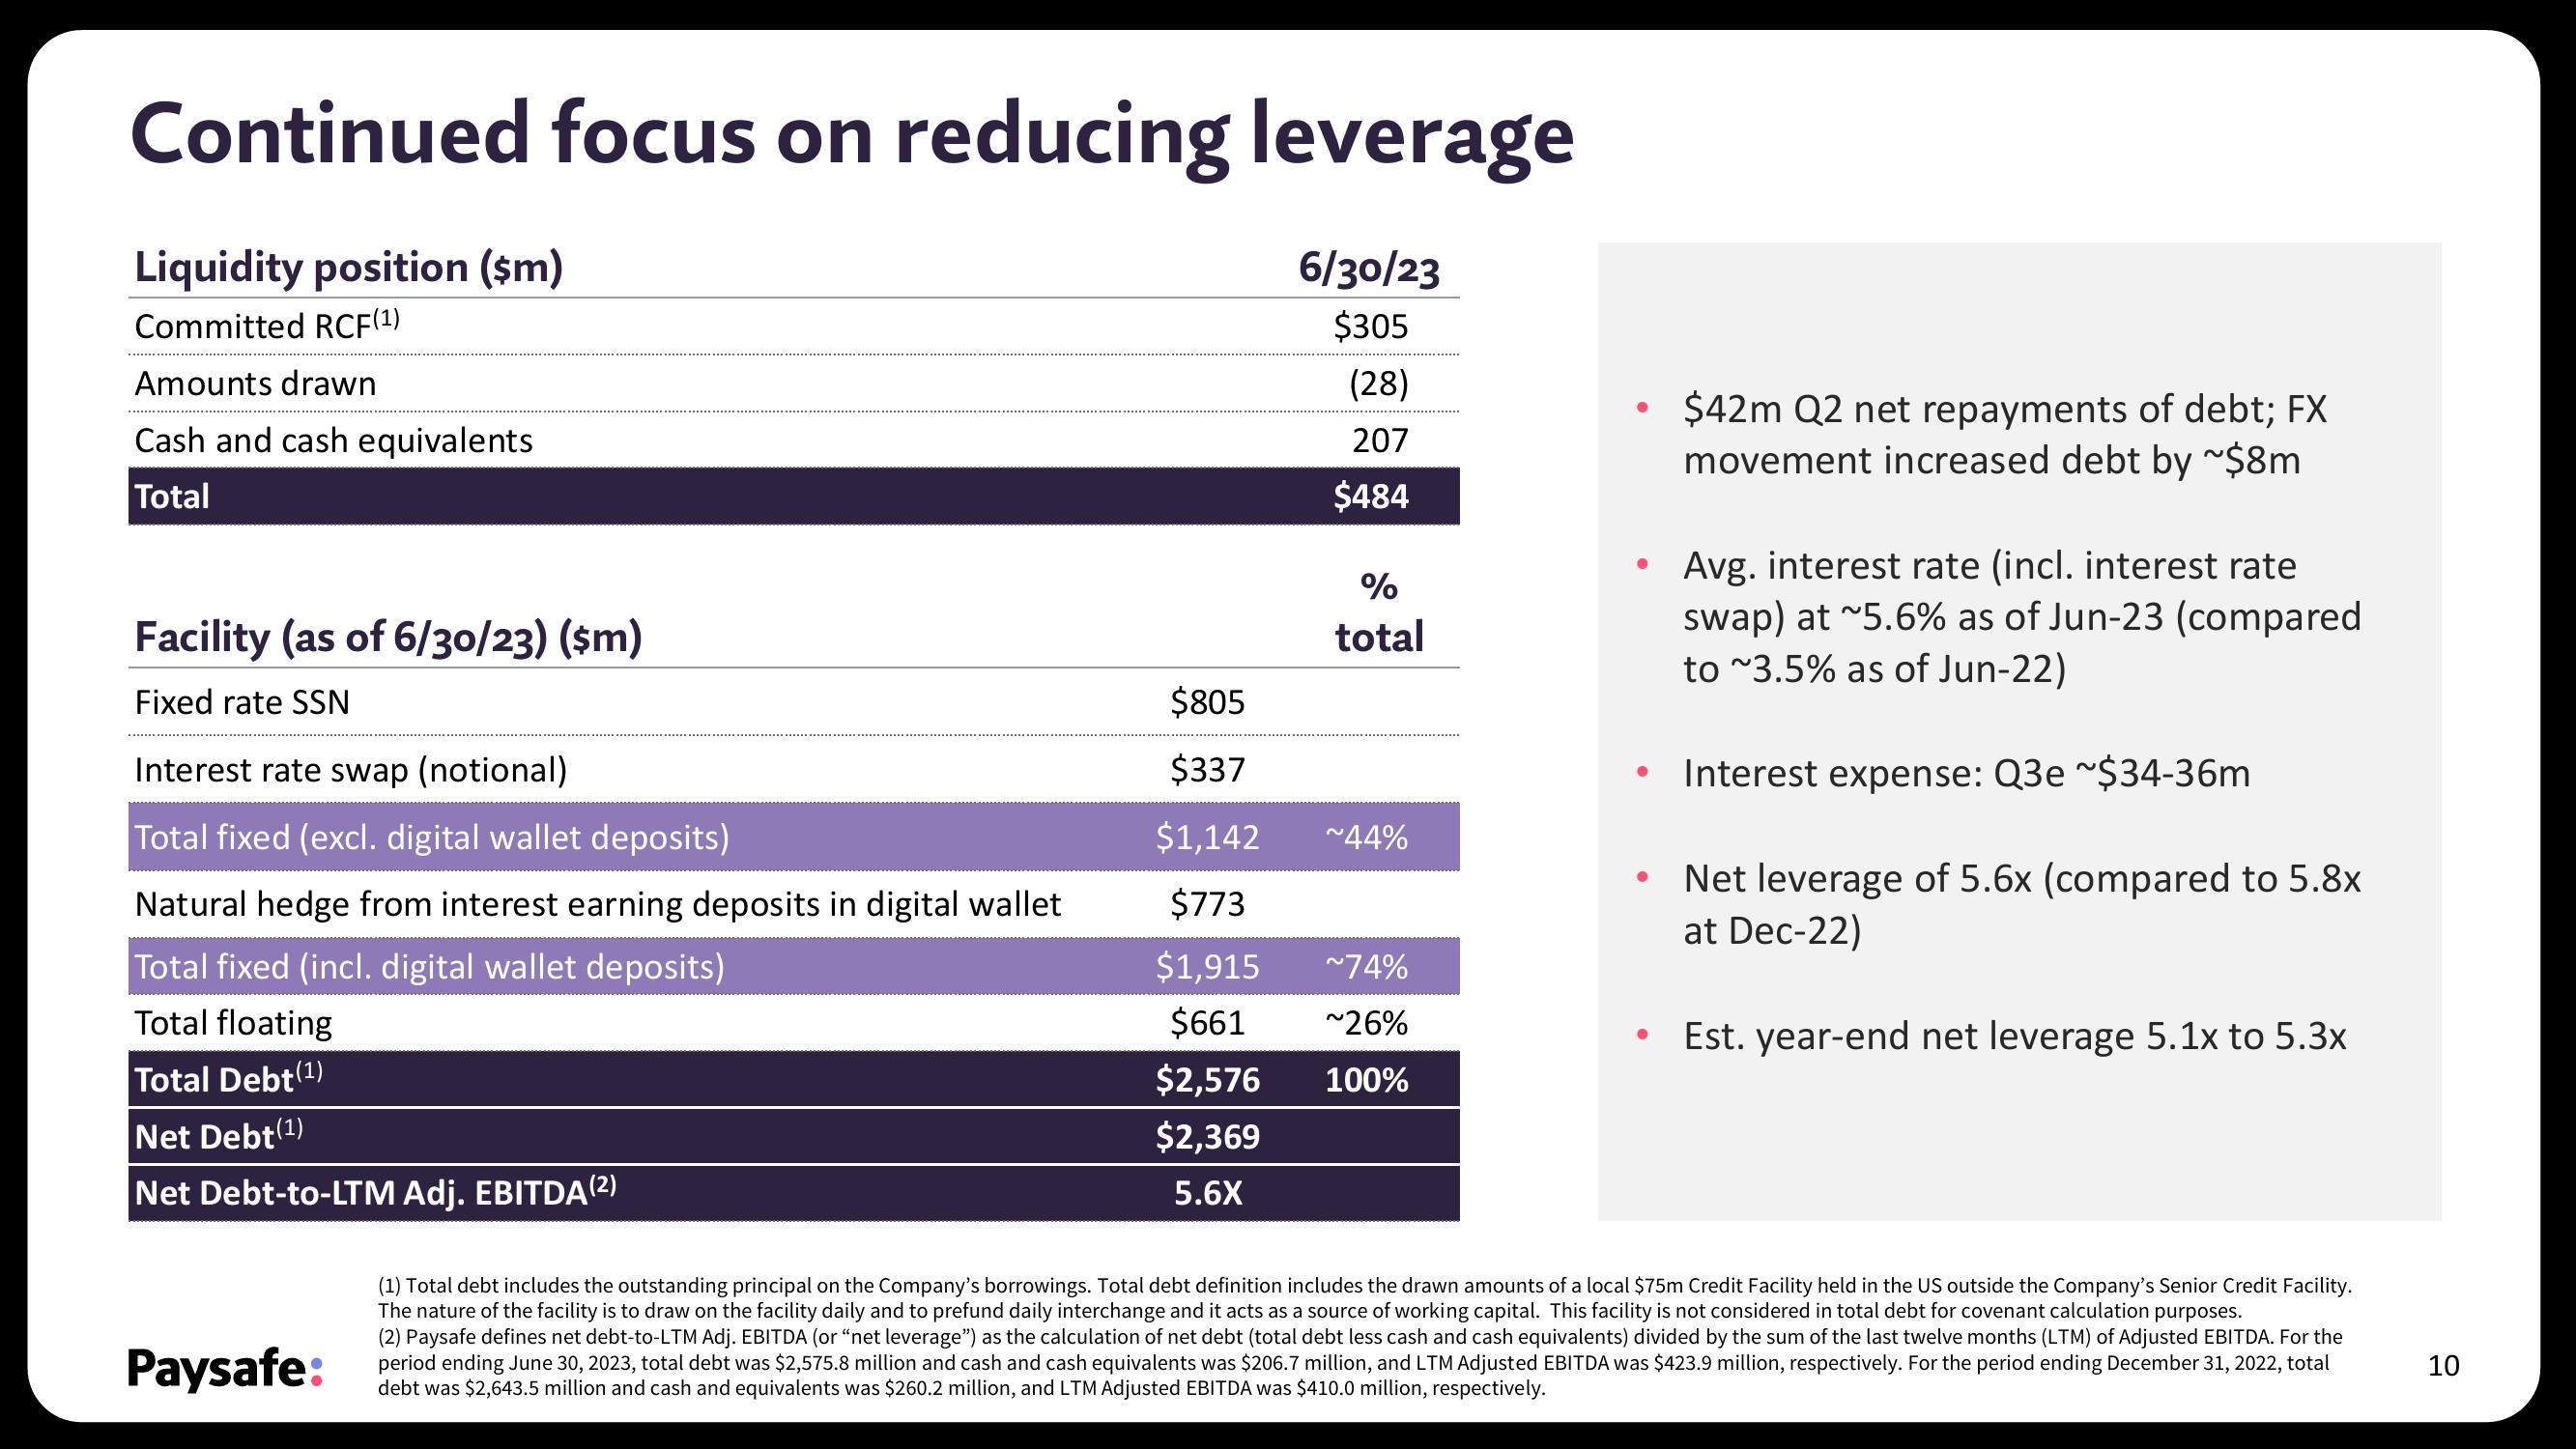
$42m Q2 net repayments of debt; FX
movement increased debt by ~$8m
Avg. interest rate (incl. interest rate
swap) at ~5.6% as of Jun-23 (compared
to ~3.5% as of Jun-22)
Interest expense: Q3e ~$34-36m
Net leverage of 5.6x (compared to 5.8x
at Dec-22)
Est. year-end net leverage 5.1x to 5.3x
(1) Total debt includes the outstanding principal on the Company's borrowings. Total debt definition includes the drawn amounts of a local $75m Credit Facility held in the US outside the Company's Senior Credit Facility.
The nature of the facility is to draw on the facility daily and to prefund daily interchange and it acts as a source of working capital. This facility is not considered in total debt for covenant calculation purposes.
(2) Paysafe defines net debt-to-LTM Adj. EBITDA (or "net leverage") as the calculation of net debt (total debt less cash and cash equivalents) divided by the sum of the last twelve months (LTM) of Adjusted EBITDA. For the
period ending June 30, 2023, total debt was $2,575.8 million and cash and cash equivalents was $206.7 million, and LTM Adjusted EBITDA was $423.9 million, respectively. For the period ending December 31, 2022, total
debt was $2,643.5 million and cash and equivalents was $260.2 million, and LTM Adjusted EBITDA was $410.0 million, respectively.
10View entire presentation