Kinnevik Results Presentation Deck
Intro
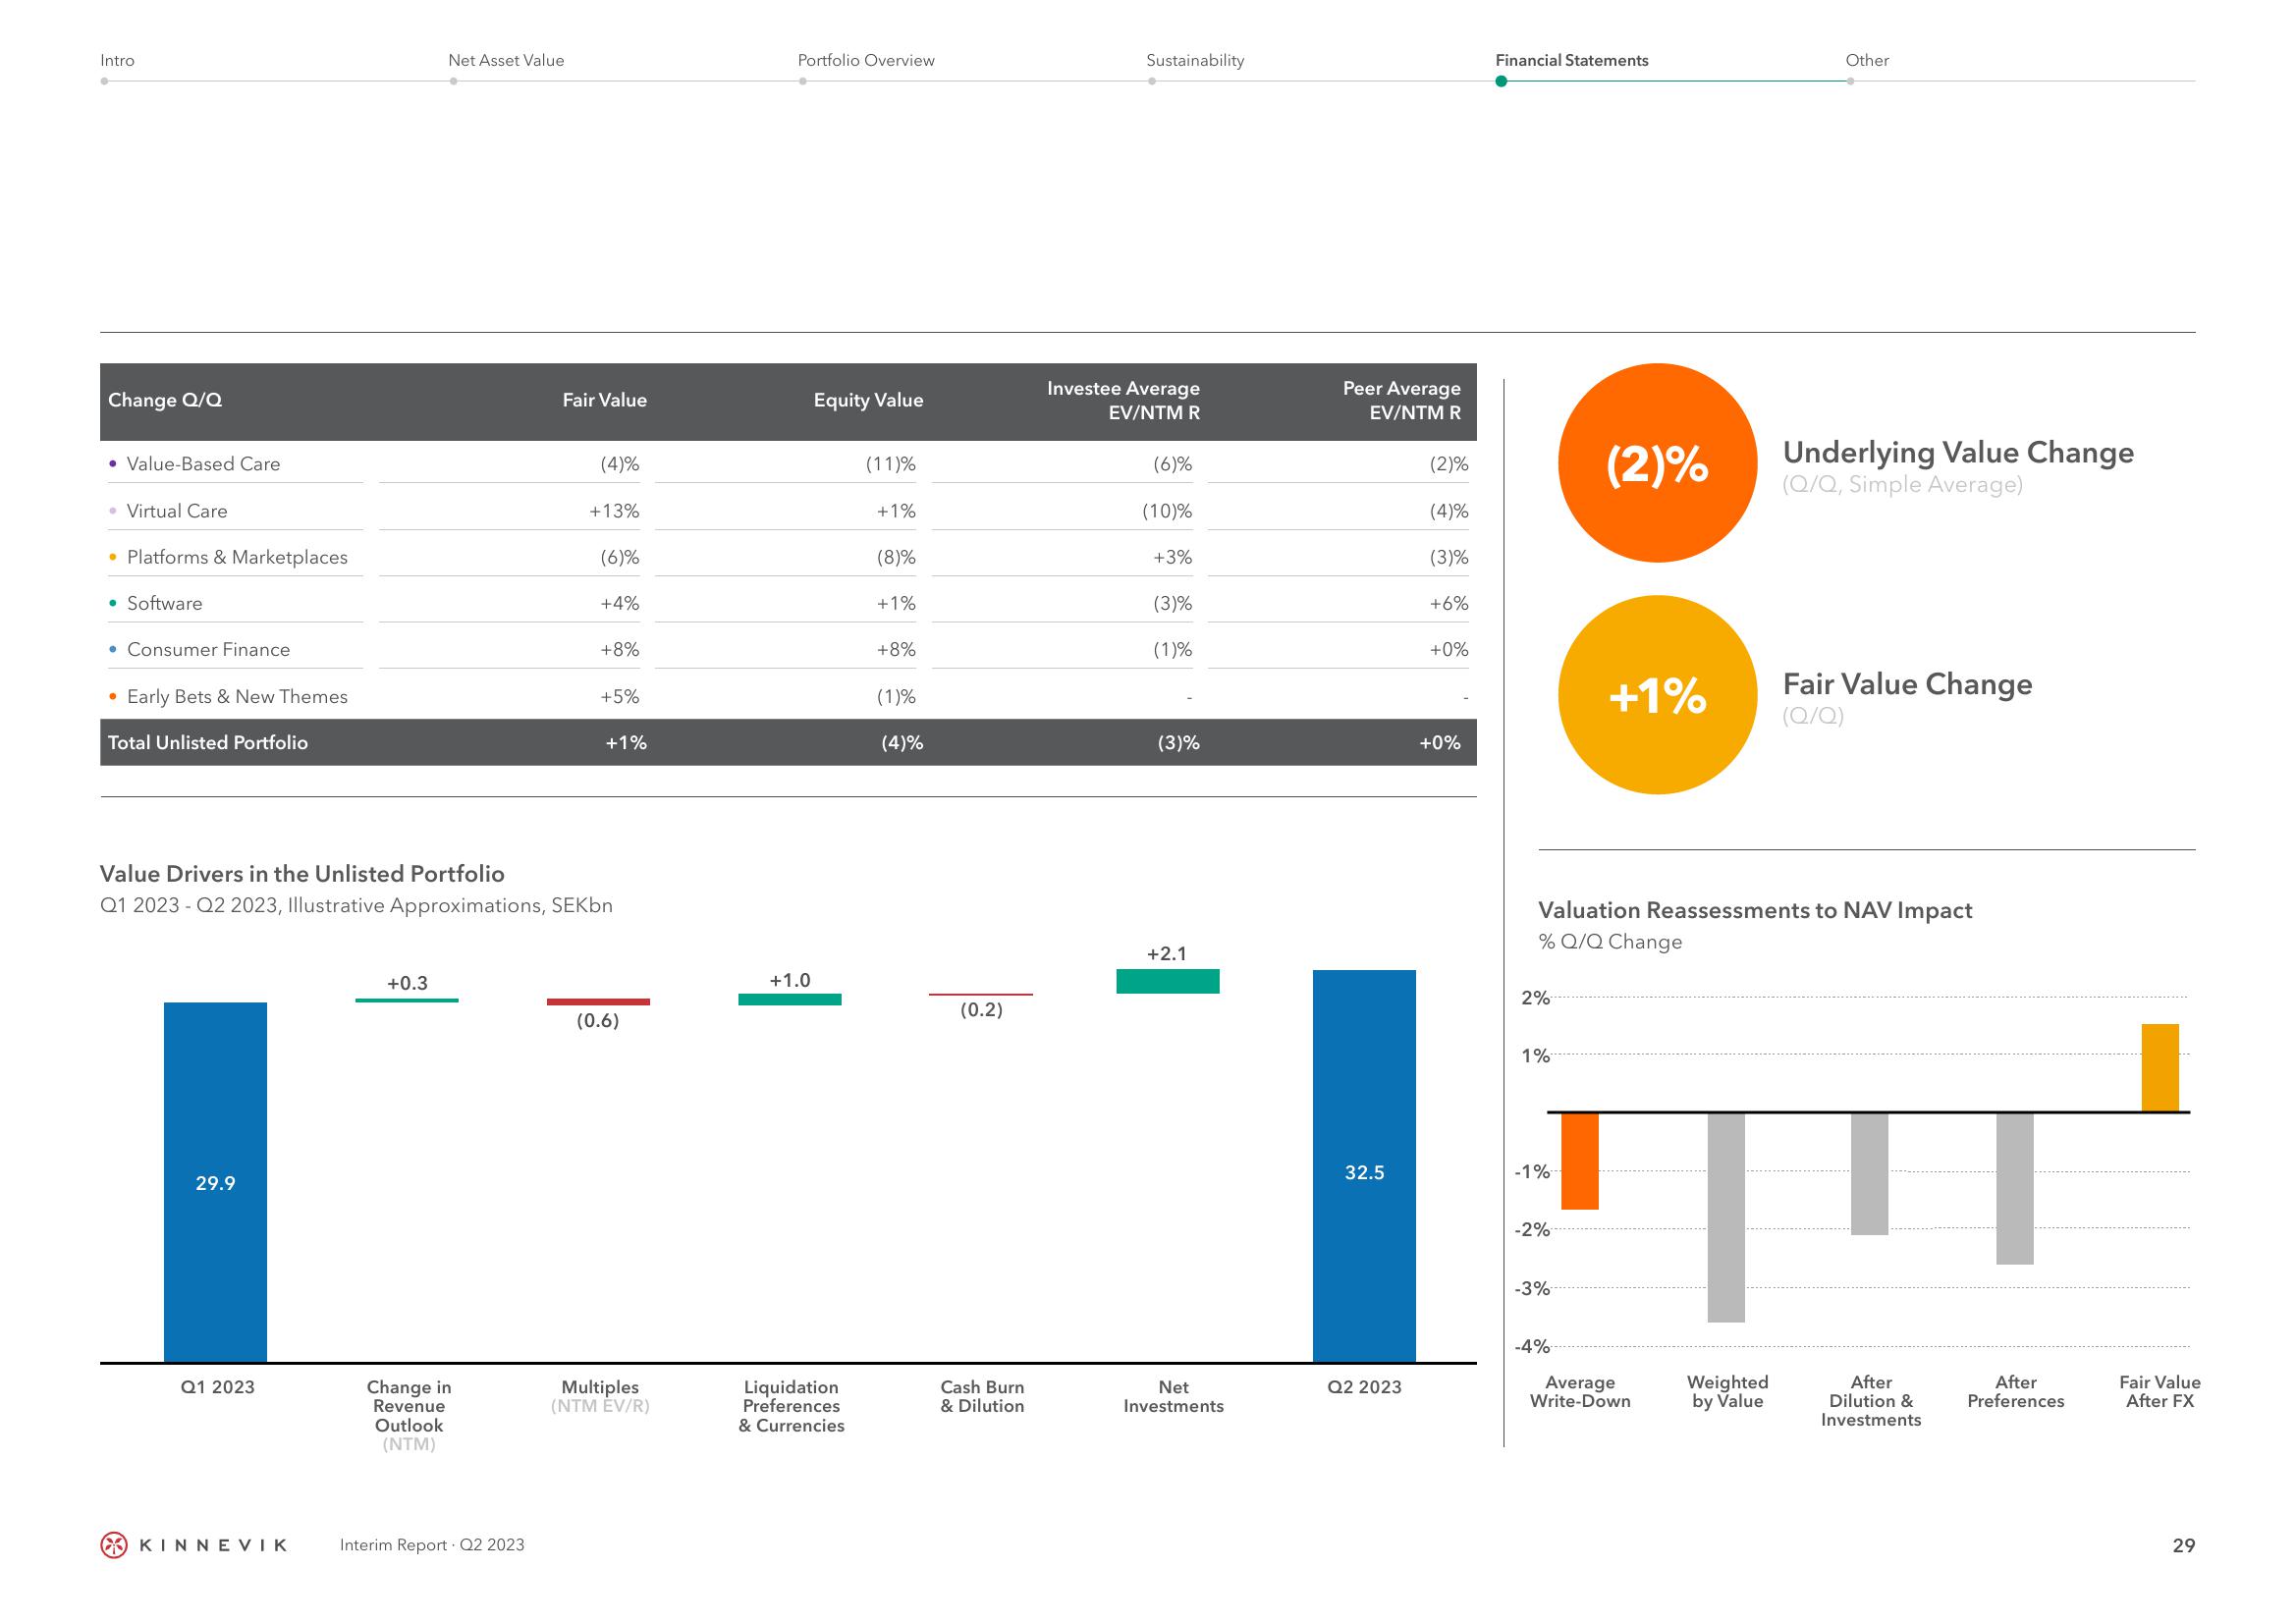
Change Q/Q
• Value-Based Care
• Virtual Care
• Platforms & Marketplaces
• Software
• Consumer Finance
• Early Bets & New Themes
Total Unlisted Portfolio
29.9
Q1 2023
KINNEVIK
Net Asset Value
+0.3
Change in
Revenue
Outlook
(NTM)
Fair Value
Interim Report Q2 2023
(4)%
+13%
Value Drivers in the Unlisted Portfolio
Q1 2023 Q2 2023, Illustrative Approximations, SEKbn
(6)%
+4%
+8%
+5%
+1%
(0.6)
Multiples
(NTM EV/R)
Portfolio Overview
+1.0
Equity Value
Liquidation
Preferences
& Currencies
(11)%
+1%
(8)%
+1%
+8%
(1)%
(4)%
(0.2)
Cash Burn
& Dilution
Sustainability
Investee Average
EV/NTM R
(6)%
(10)%
+3%
(3)%
(1)%
(3)%
+2.1
Net
Investments
Peer Average
EV/NTM R
32.5
Q2 2023
(2)%
(4)%
(3)%
+6%
+0%
+0%
Financial Statements
2%
1%
-1%
-2%
Valuation Reassessments to NAV Impact
% Q/Q Change
-3%
(2)%
-4%
+1%
Average
Write-Down
Other
Weighted
by Value
Underlying Value Change
(Q/Q, Simple Average)
Fair Value Change
(Q/Q)
After
Dilution &
Investments
After
Preferences
Fair Value
After FX
29View entire presentation