Membership Collective Group Results Presentation Deck
Reconciliation of GAAP to Non-GAAP Financial Measures
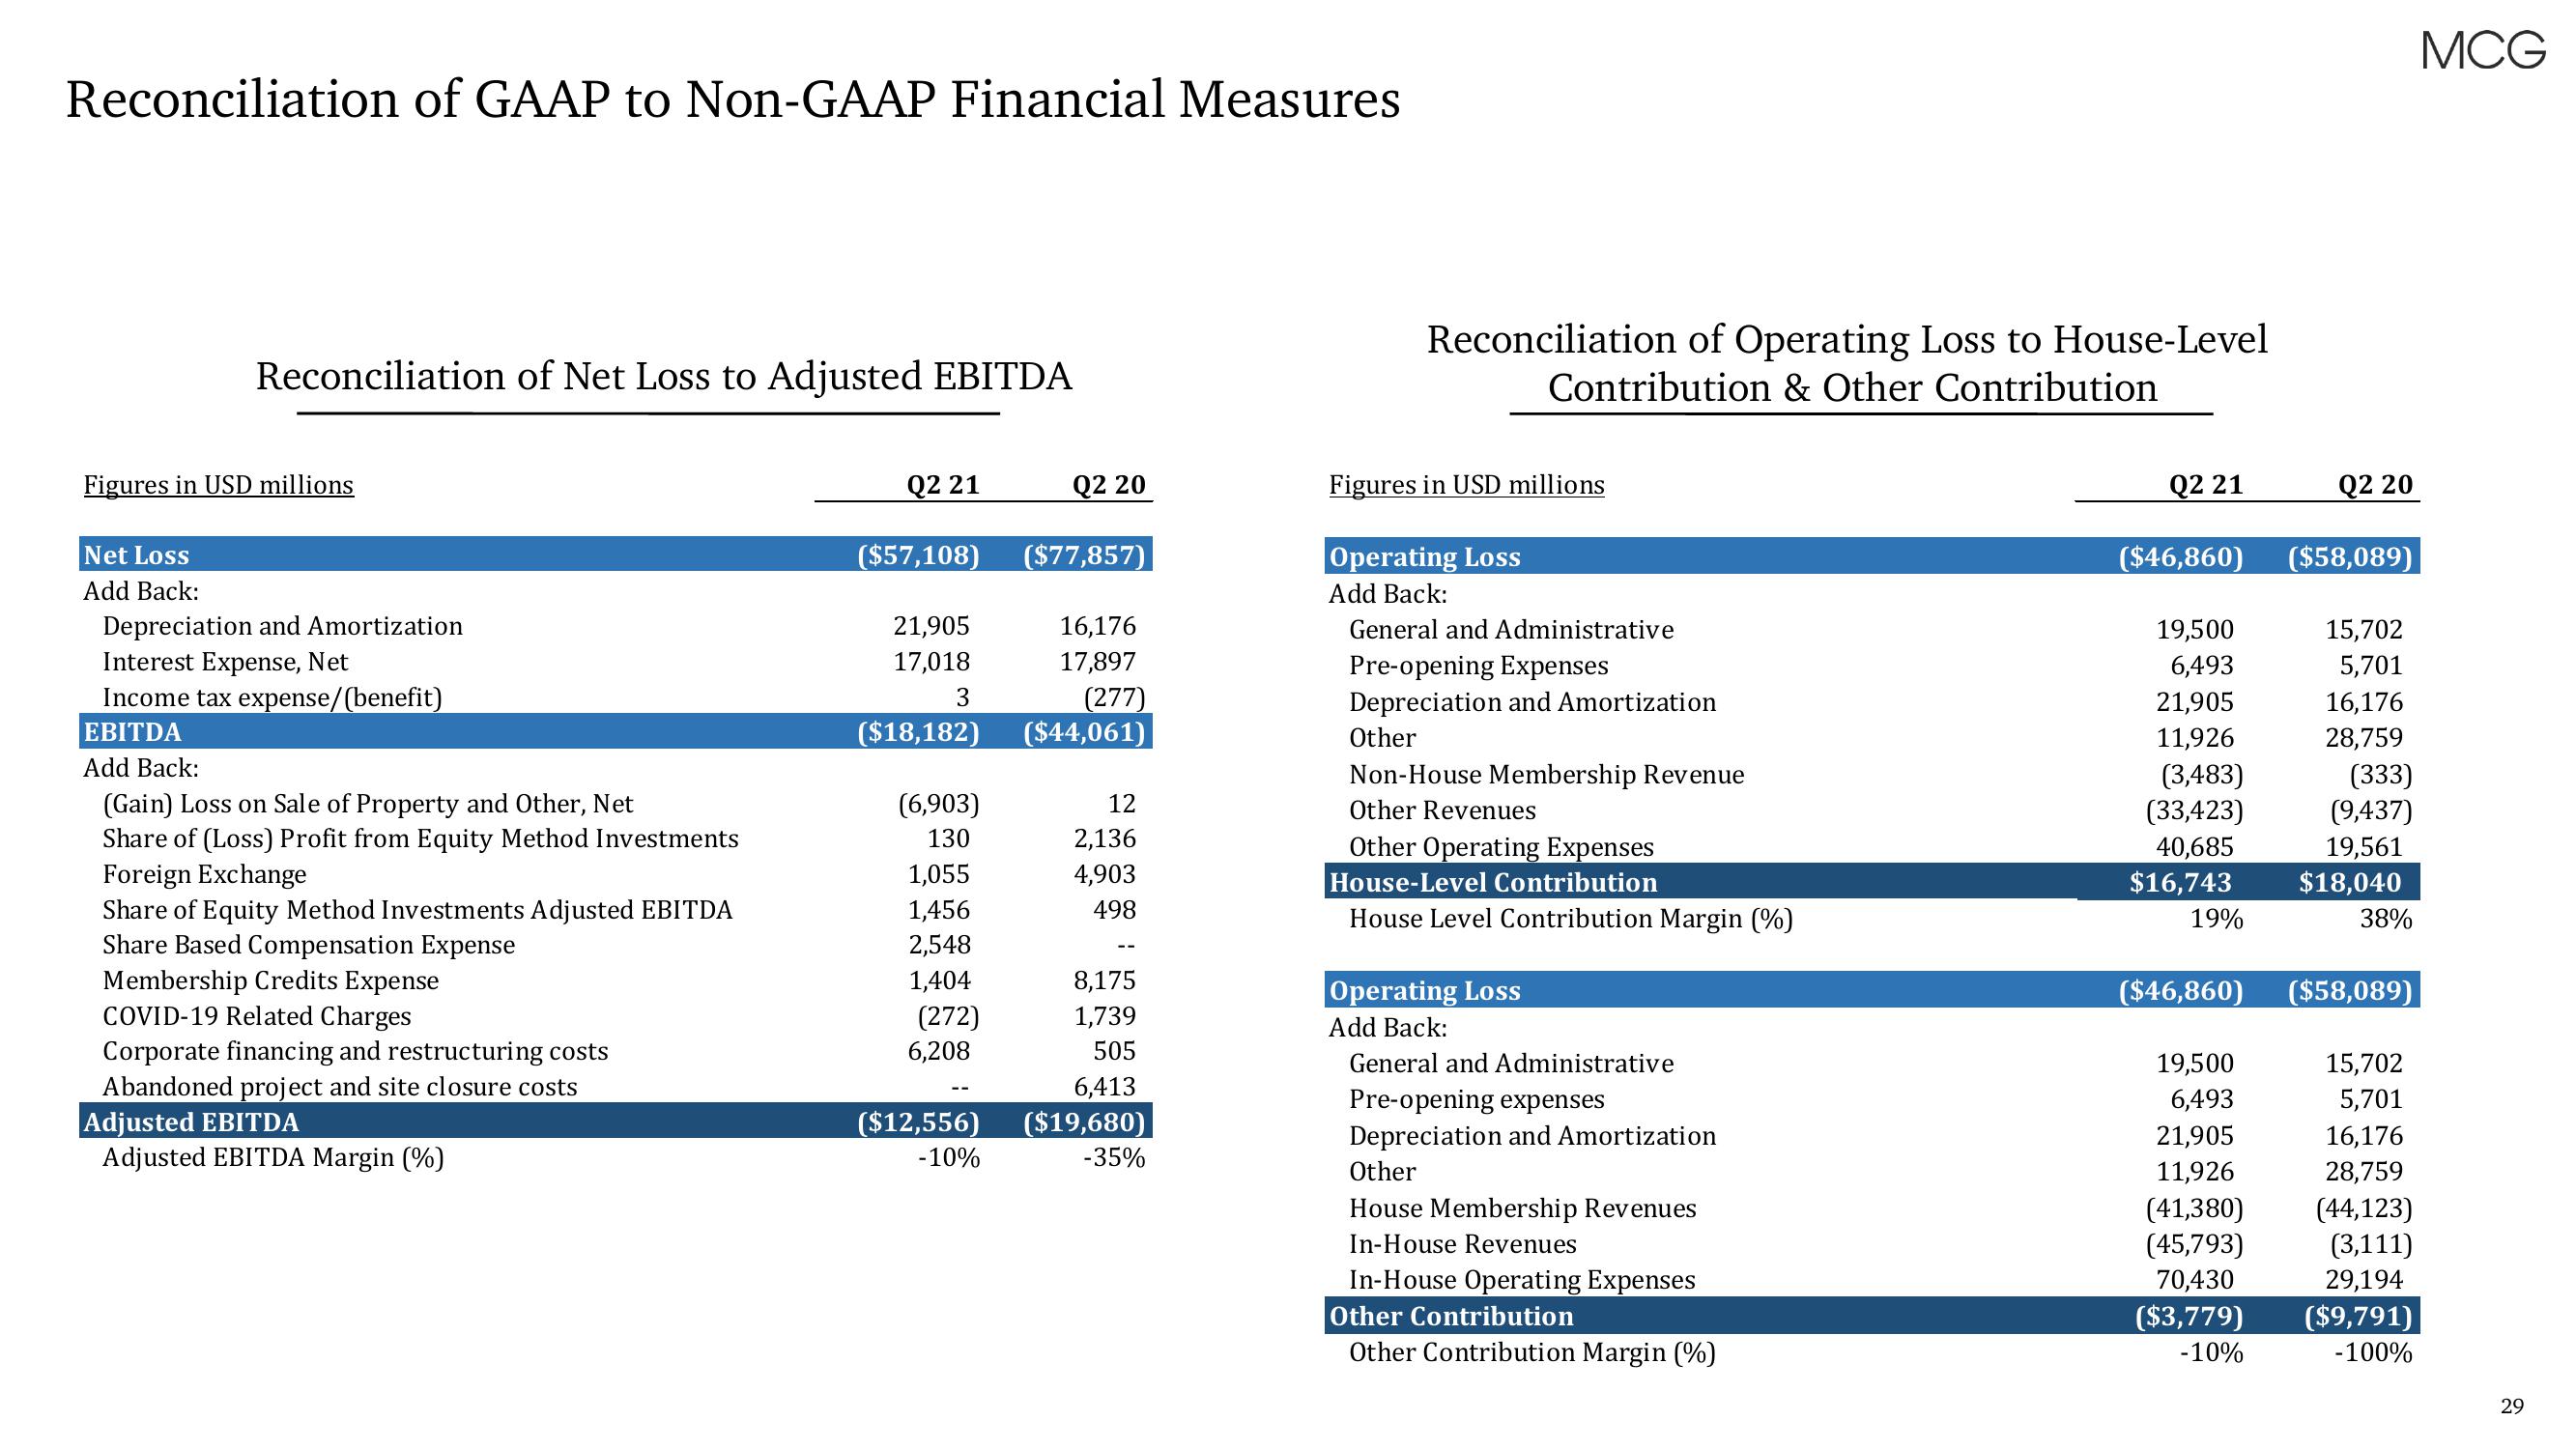
Reconciliation of Net Loss to Adjusted EBITDA
Figures in USD millions
Net Loss
Add Back:
Depreciation and Amortization
Interest Expense, Net
Income tax expense/(benefit)
EBITDA
Add Back:
(Gain) Loss on Sale of Property and Other, Net
Share of (Loss) Profit from Equity Method Investments
Foreign Exchange
Share of Equity Method Investments Adjusted EBITDA
Share Based Compensation Expense
Membership Credits Expense
COVID-19 Related Charges
Corporate financing and restructuring costs
Abandoned project and site closure costs
Adjusted EBITDA
Adjusted EBITDA Margin (%)
Q2 21
($57,108)
21,905
17,018
3
($18,182)
(6,903)
130
1,055
1,456
2,548
1,404
(272)
6,208
($12,556)
-10%
Q2 20
($77,857)
16,176
17,897
(277)
($44,061)
12
2,136
4,903
498
8,175
1,739
505
6,413
($19,680)
-35%
Reconciliation of Operating Loss to House-Level
Contribution & Other Contribution
Figures in USD millions
Operating Loss
Add Back:
General and Administrative
Pre-opening Expenses
Depreciation and Amortization
Other
Non-House Membership Revenue
Other Revenues
Other Operating Expenses
House-Level Contribution
House Level Contribution Margin (%)
Operating Loss
Add Back:
General and Administrative
Pre-opening expenses
Depreciation and Amortization
Other
House Membership Revenues
In-House Revenues
In-House Operating Expenses
Other Contribution
Other Contribution Margin (%)
Q2 21
($46,860)
19,500
6,493
21,905
11,926
(3,483)
(33,423)
40,685
$16,743
19%
Q2 20
19,500
6,493
21,905
11,926
(41,380)
(45,793)
70,430
($3,779)
-10%
($58,089)
15,702
5,701
16,176
28,759
(333)
(9,437)
19,561
$18,040
38%
($46,860) ($58,089)
15,702
5,701
16,176
28,759
(44,123)
(3,111)
29,194
($9,791)
-100%
MCG
29View entire presentation