Maersk Investor Presentation Deck
Financial highlights FY 2020
Strong free cash flow allowing for acquisitions and debt repayments
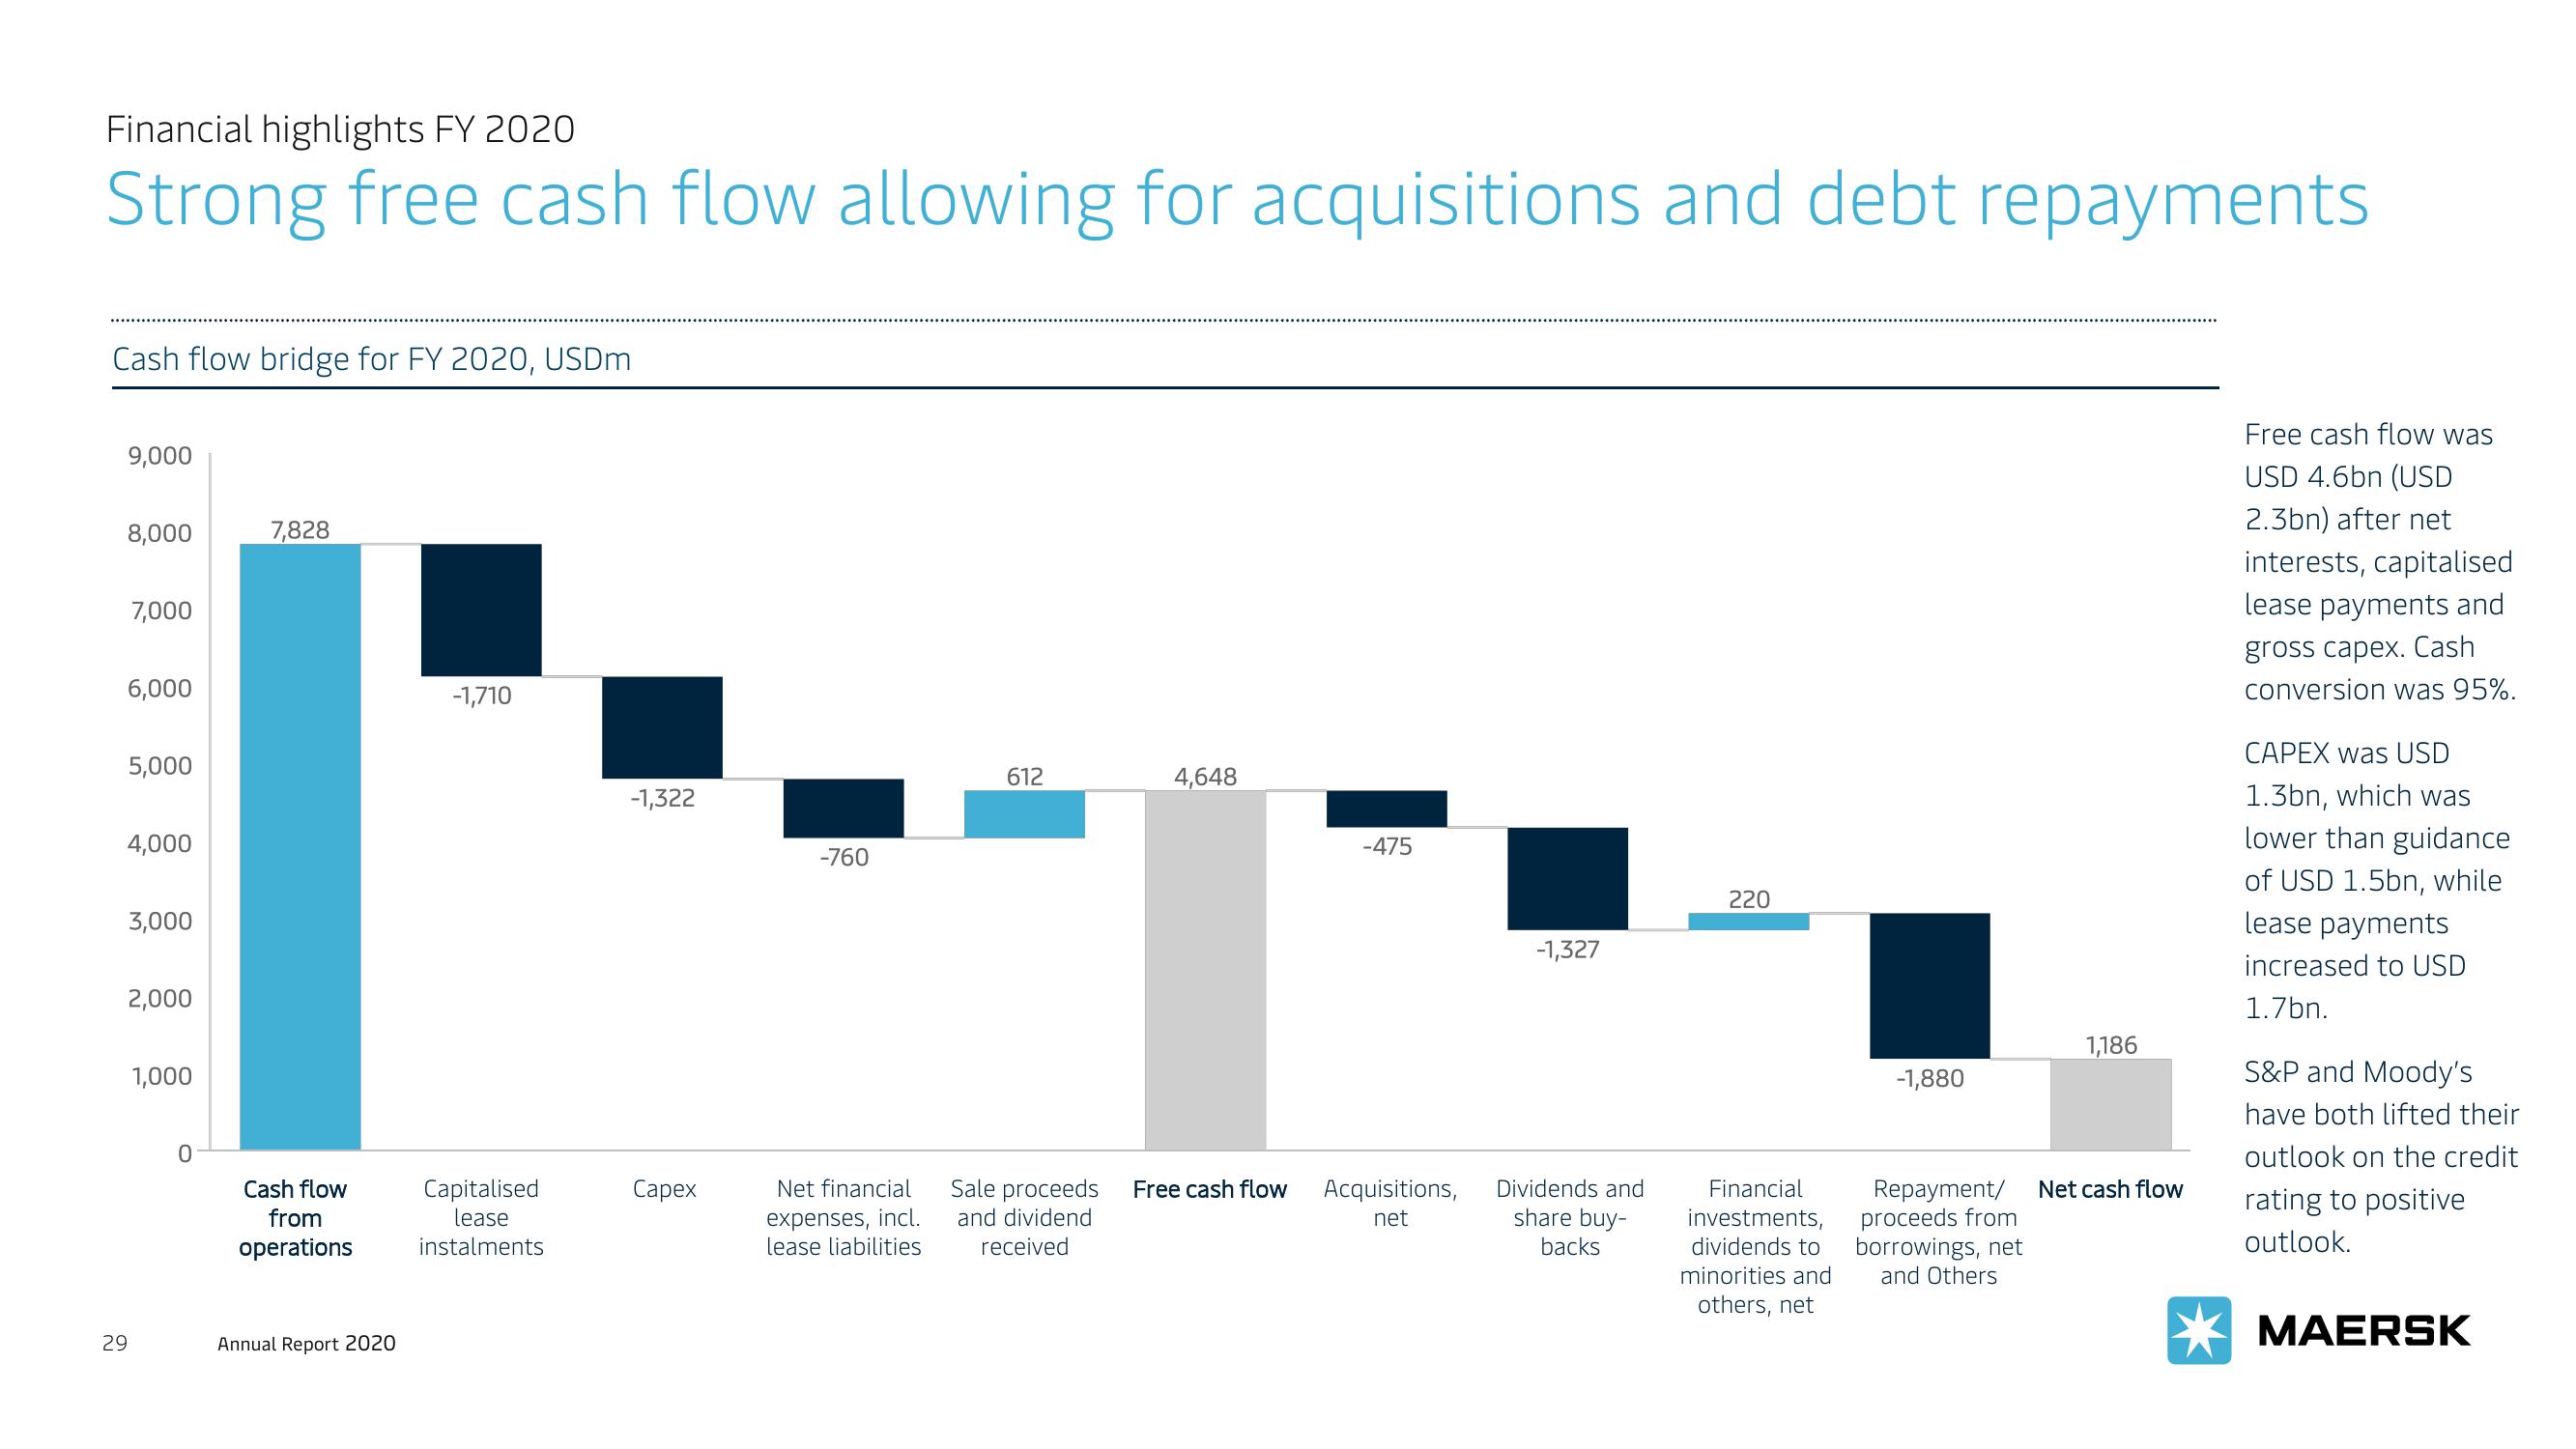
Cash flow bridge for FY 2020, USDm
9,000
8,000
29
7,000
6,000
5,000
4,000
3,000
2,000
1,000
0
7,828
Cash flow
from
operations
Annual Report 2020
-1,710
Capitalised
lease
instalments
-1,322
Capex
-760
Net financial
expenses, incl.
lease liabilities
612
4,648
-475
Sale proceeds Free cash flow Acquisitions,
and dividend
net
received
-1,327
Dividends and
share buy-
backs
220
Financial
investments,
dividends to
minorities and
others, net
-1,880
1,186
Repayment/ Net cash flow
proceeds from
borrowings, net
and Others
Free cash flow was
USD 4.6bn (USD
2.3bn) after net
interests, capitalised
lease payments and
gross capex. Cash
conversion was 95%.
CAPEX was USD
1.3bn, which was
lower than guidance
of USD 1.5bn, while
lease payments
increased to USD
1.7bn.
S&P and Moody's
have both lifted their
outlook on the credit
rating to positive
outlook.
MAERSKView entire presentation