Shopify Investor Presentation Deck
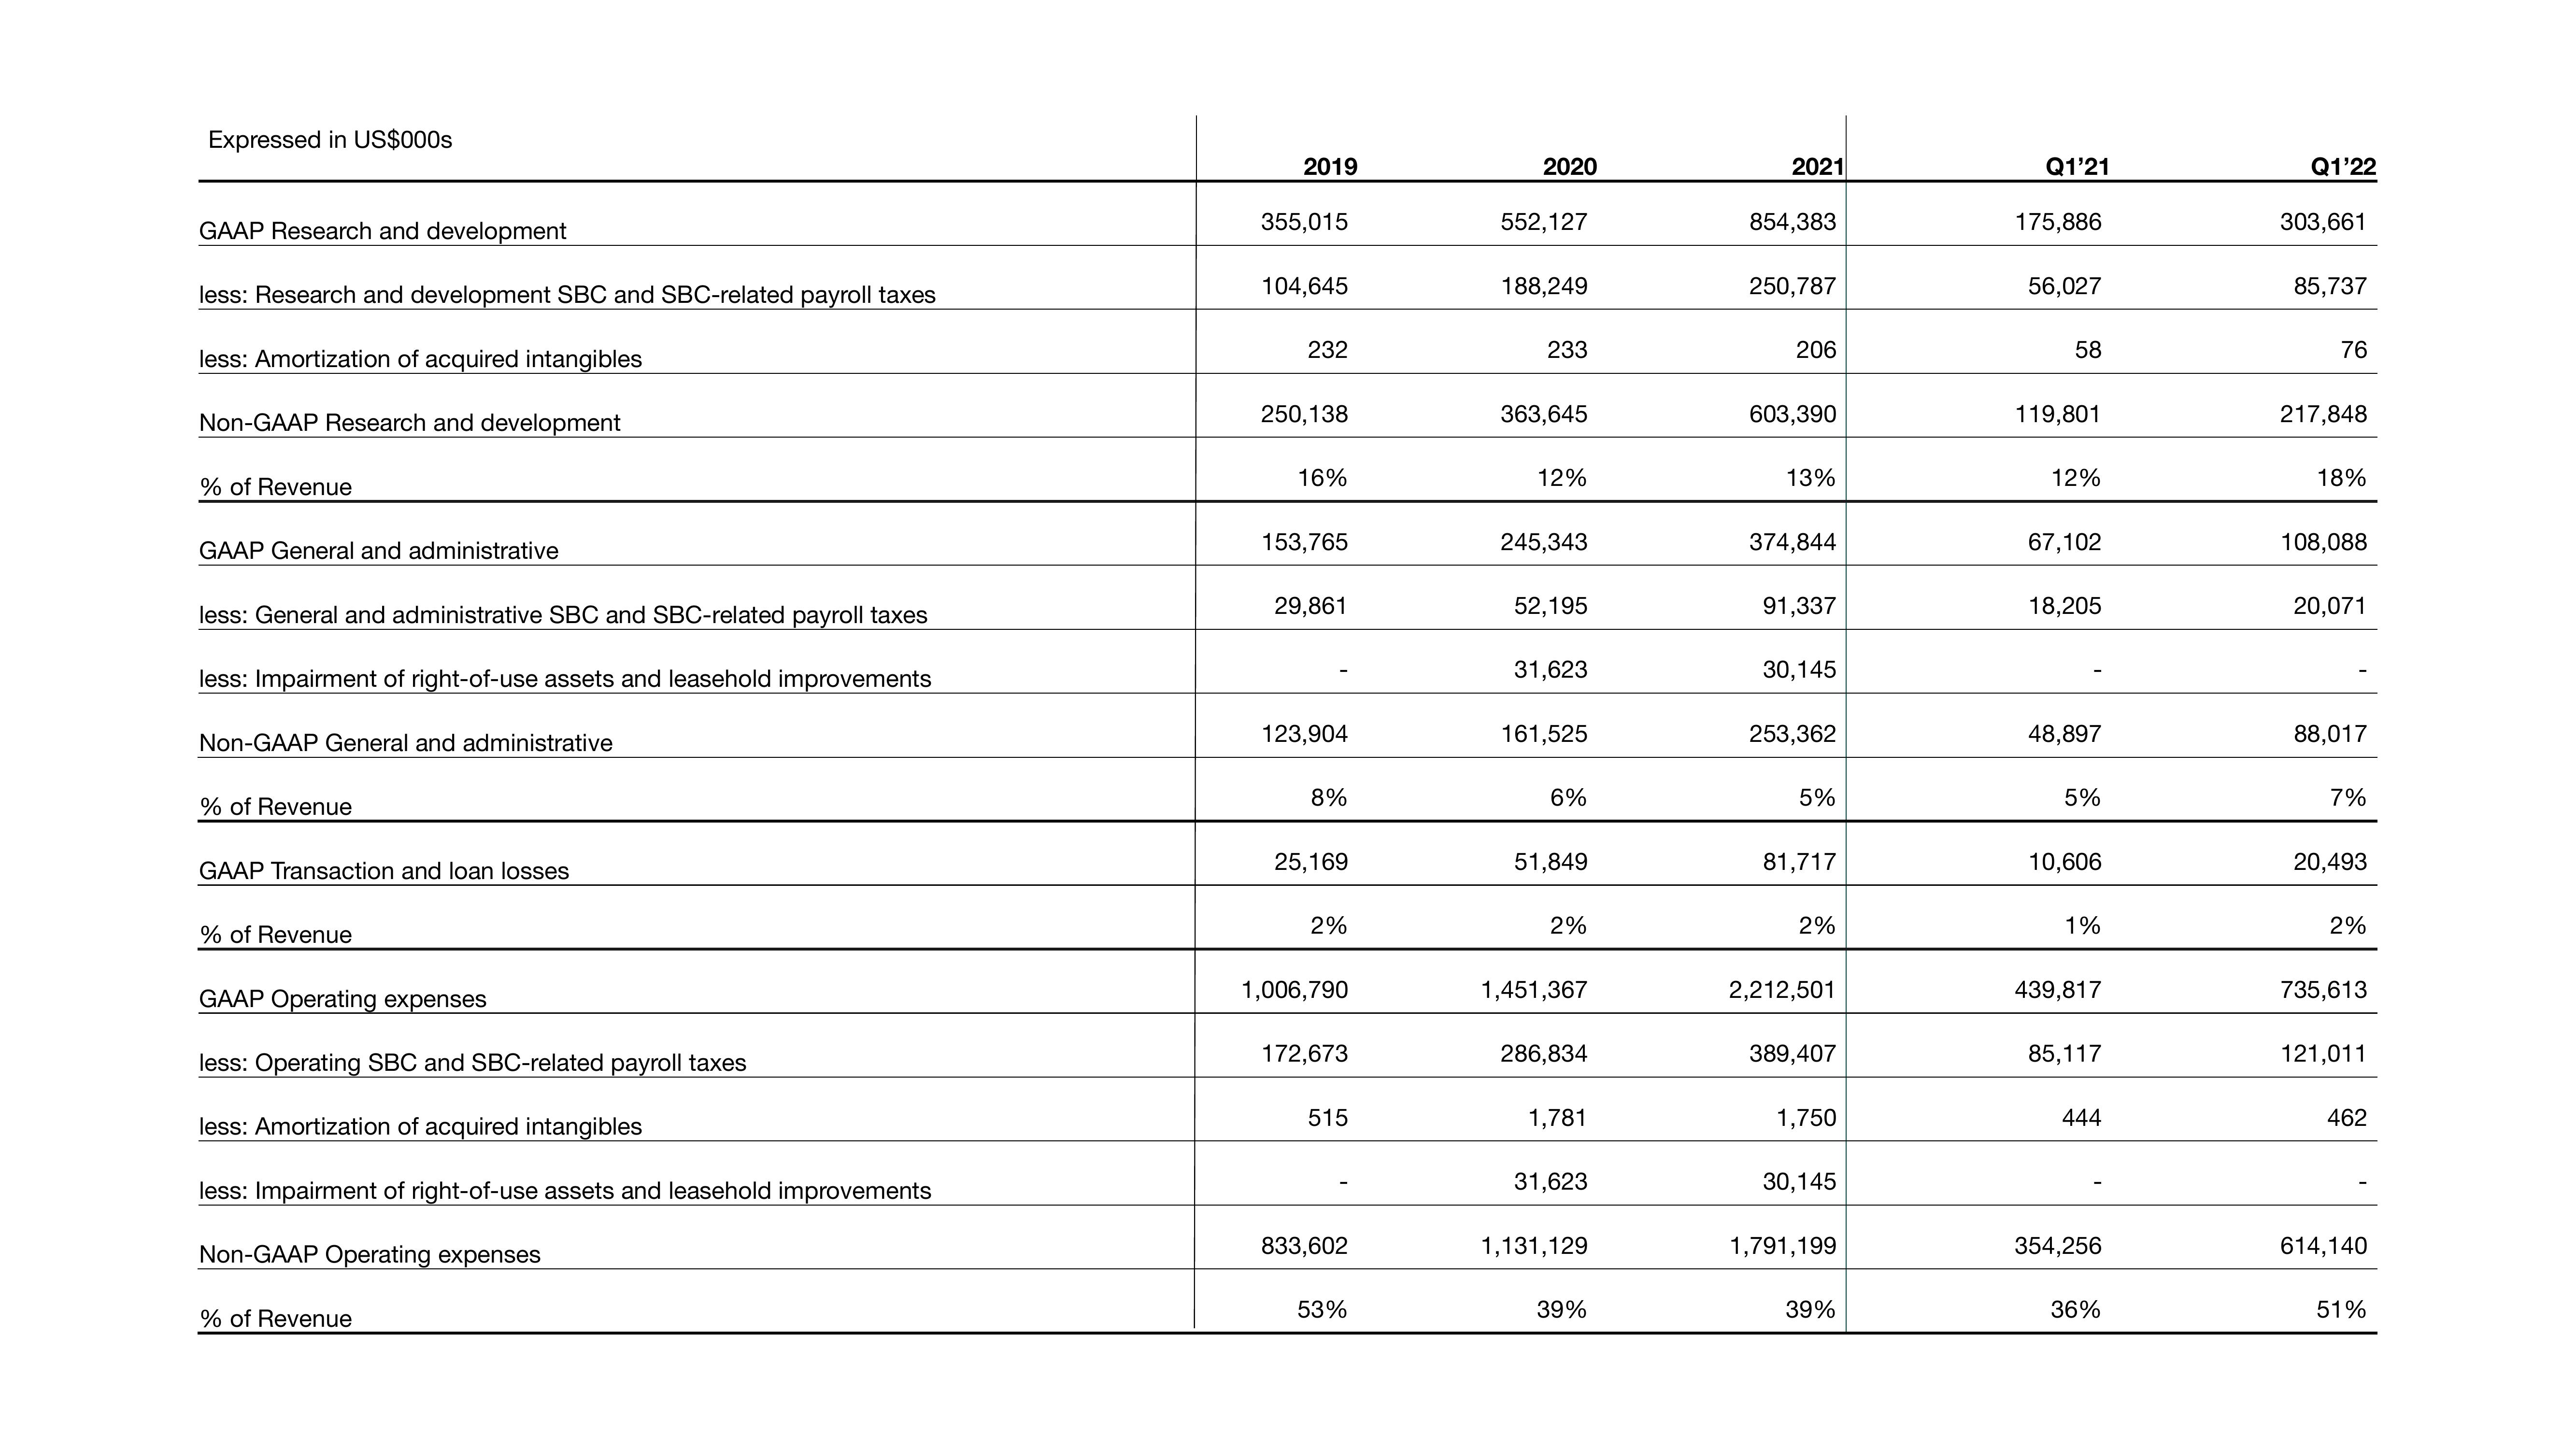
Expressed in US$000s
GAAP Research and development
less: Research and development SBC and SBC-related payroll taxes
less: Amortization of acquired intangibles
Non-GAAP Research and development
% of Revenue
GAAP General and administrative
less: General and administrative SBC and SBC-related payroll taxes
less: Impairment of right-of-use assets and leasehold improvements
Non-GAAP General and administrative
% of Revenue
GAAP Transaction and loan losses
% of Revenue
GAAP Operating expenses
less: Operating SBC and SBC-related payroll taxes
less: Amortization of acquired intangibles
less: Impairment of right-of-use assets and leasehold improvements
Non-GAAP Operating expenses
% of Revenue
2019
355,015
104,645
232
250,138
16%
153,765
29,861
123,904
8%
25,169
2%
1,006,790
172,673
515
833,602
53%
2020
552,127
188,249
233
363,645
12%
245,343
52,195
31,623
161,525
6%
51,849
2%
1,451,367
286,834
1,781
31,623
1,131,129
39%
2021
854,383
250,787
206
603,390
13%
374,844
91,337
30,145
253,362
5%
81,717
2%
2,212,501
389,407
1,750
30,145
1,791,199
39%
Q1'21
175,886
56,027
58
119,801
12%
67,102
18,205
48,897
5%
10,606
1%
439,817
85,117
444
354,256
36%
Q1'22
303,661
85,737
76
217,848
18%
108,088
20,071
88,017
7%
20,493
2%
735,613
121,011
462
614,140
51%View entire presentation