Main Street Capital Investor Day Presentation Deck
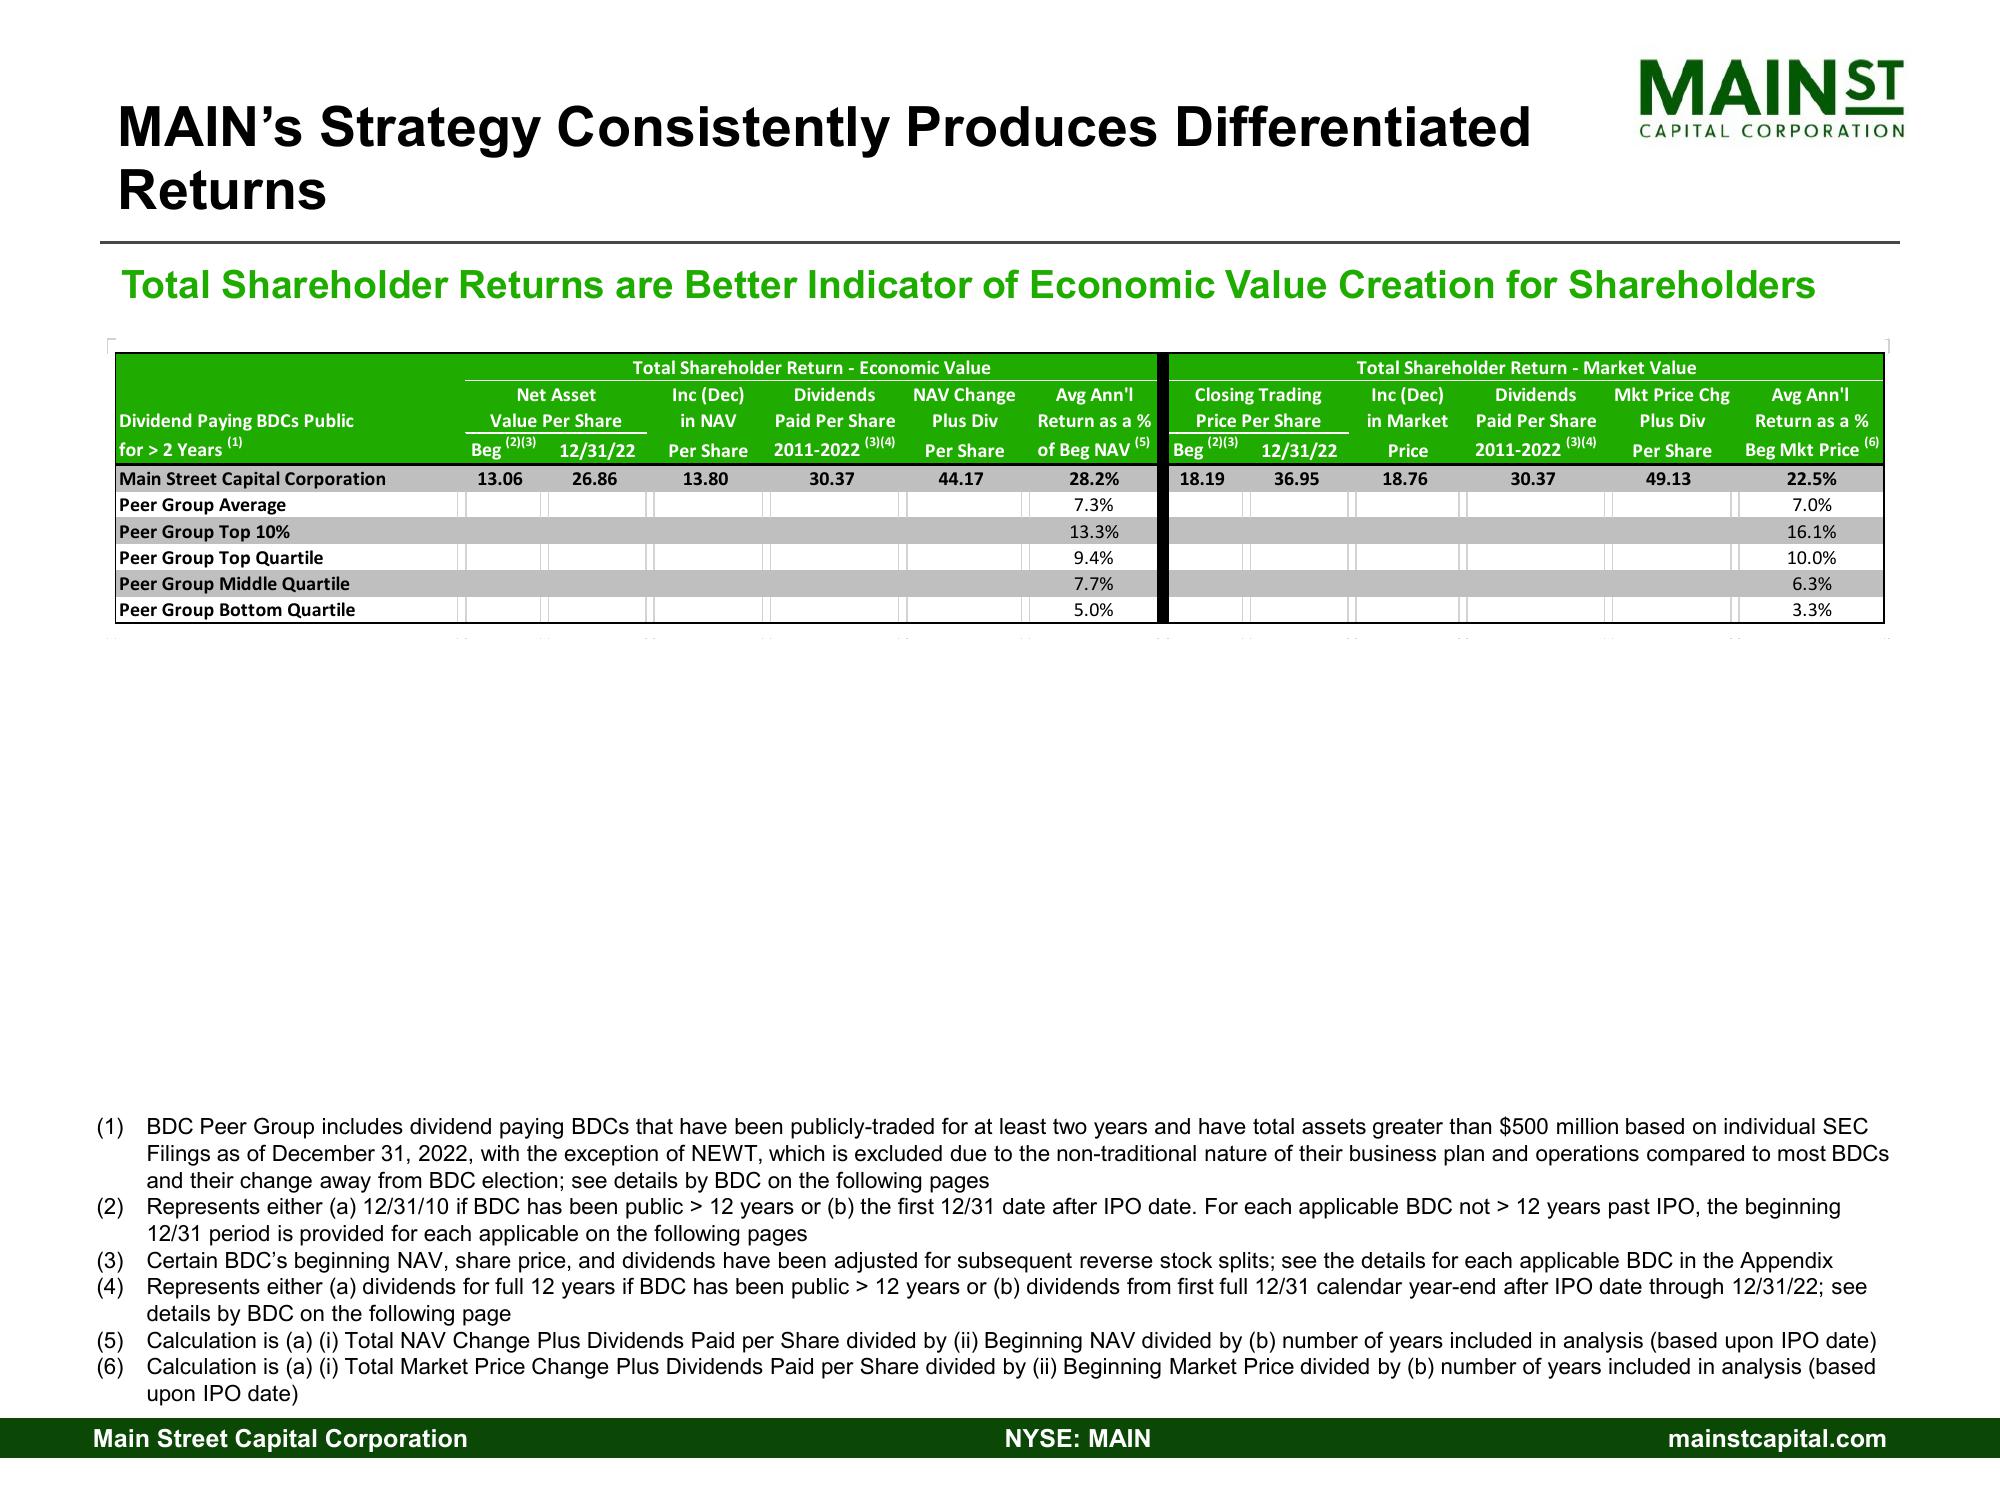
MAIN's Strategy Consistently Produces Differentiated
Returns
Dividend Paying BDCs Public
(1)
for > 2 Years
Total Shareholder Returns are Better Indicator of Economic Value Creation for Shareholders
Main Street Capital Corporation
Peer Group Average
Peer Group Top 10%
Peer Group Top Quartile
Peer Group Middle Quartile
Peer Group Bottom Quartile
Net Asset
Value Per Share
(2)(3)
Beg
13.06
Total Shareholder Return - Economic Value
NAV Change
Plus Div
Per Share
44.17
Inc (Dec)
in NAV
Per Share
Dividends
Paid Per Share
2011-2022 (3)(4)
13.80
30.37
12/31/22
26.86
Avg Ann'l
Return as a %
of Beg NAV (5)
28.2%
7.3%
13.3%
9.4%
7.7%
5.0%
Closing Trading
Price Per Share
(2)(3)
12/31/22
36.95
MAINST
Beg
18.19
NYSE: MAIN
CAPITAL CORPORATION
Total Shareholder Return - Market Value
Inc (Dec) Dividends Mkt Price Chg
in Market Paid Per Share Plus Div
Price
2011-2022 (3) (4)
Per Share
18.76
30.37
49.13
Avg Ann'l
Return as a %
(6)
Beg Mkt Price
22.5%
7.0%
16.1%
10.0%
6.3%
3.3%
(1) BDC Peer Group includes dividend paying BDCs that have been publicly-traded for at least two years and have total assets greater than $500 million based on individual SEC
Filings as of December 31, 2022, with the exception of NEWT, which is excluded due to the non-traditional nature of their business plan and operations compared to most BDCs
and their change away from BDC election; see details by BDC on the following pages
Represents either (a) 12/31/10 if BDC has been public > 12 years or (b) the first 12/31 date after IPO date. For each applicable BDC not > 12 years past IPO, the beginning
12/31 period is provided for each applicable on the following pages
(2)
(3) Certain BDC's beginning NAV, share price, and dividends have been adjusted for subsequent reverse stock splits; see the details for each applicable BDC in the Appendix
(4) Represents either (a) dividends for full 12 years if BDC ha been public > 12 years or (b) dividends from first full 12/31 calendar year-end after IPC through 12/31/22; see
details by BDC on the following page
(5) Calculation is (a) (i) Total NAV Change Plus Dividends Paid per Share divided by (ii) Beginning NAV divided by (b) number of years included in analysis (based upon IPO date)
(6) Calculation is (a) (i) Total Market Price Change Plus Dividends Paid per Share divided by (ii) Beginning Market Price divided by (b) number of years included in analysis (based
upon IPO date)
Main Street Capital Corporation
mainstcapital.comView entire presentation