Ciena Corporation Earnings Presentation slide image

Ciena Corporation Earnings Presentation

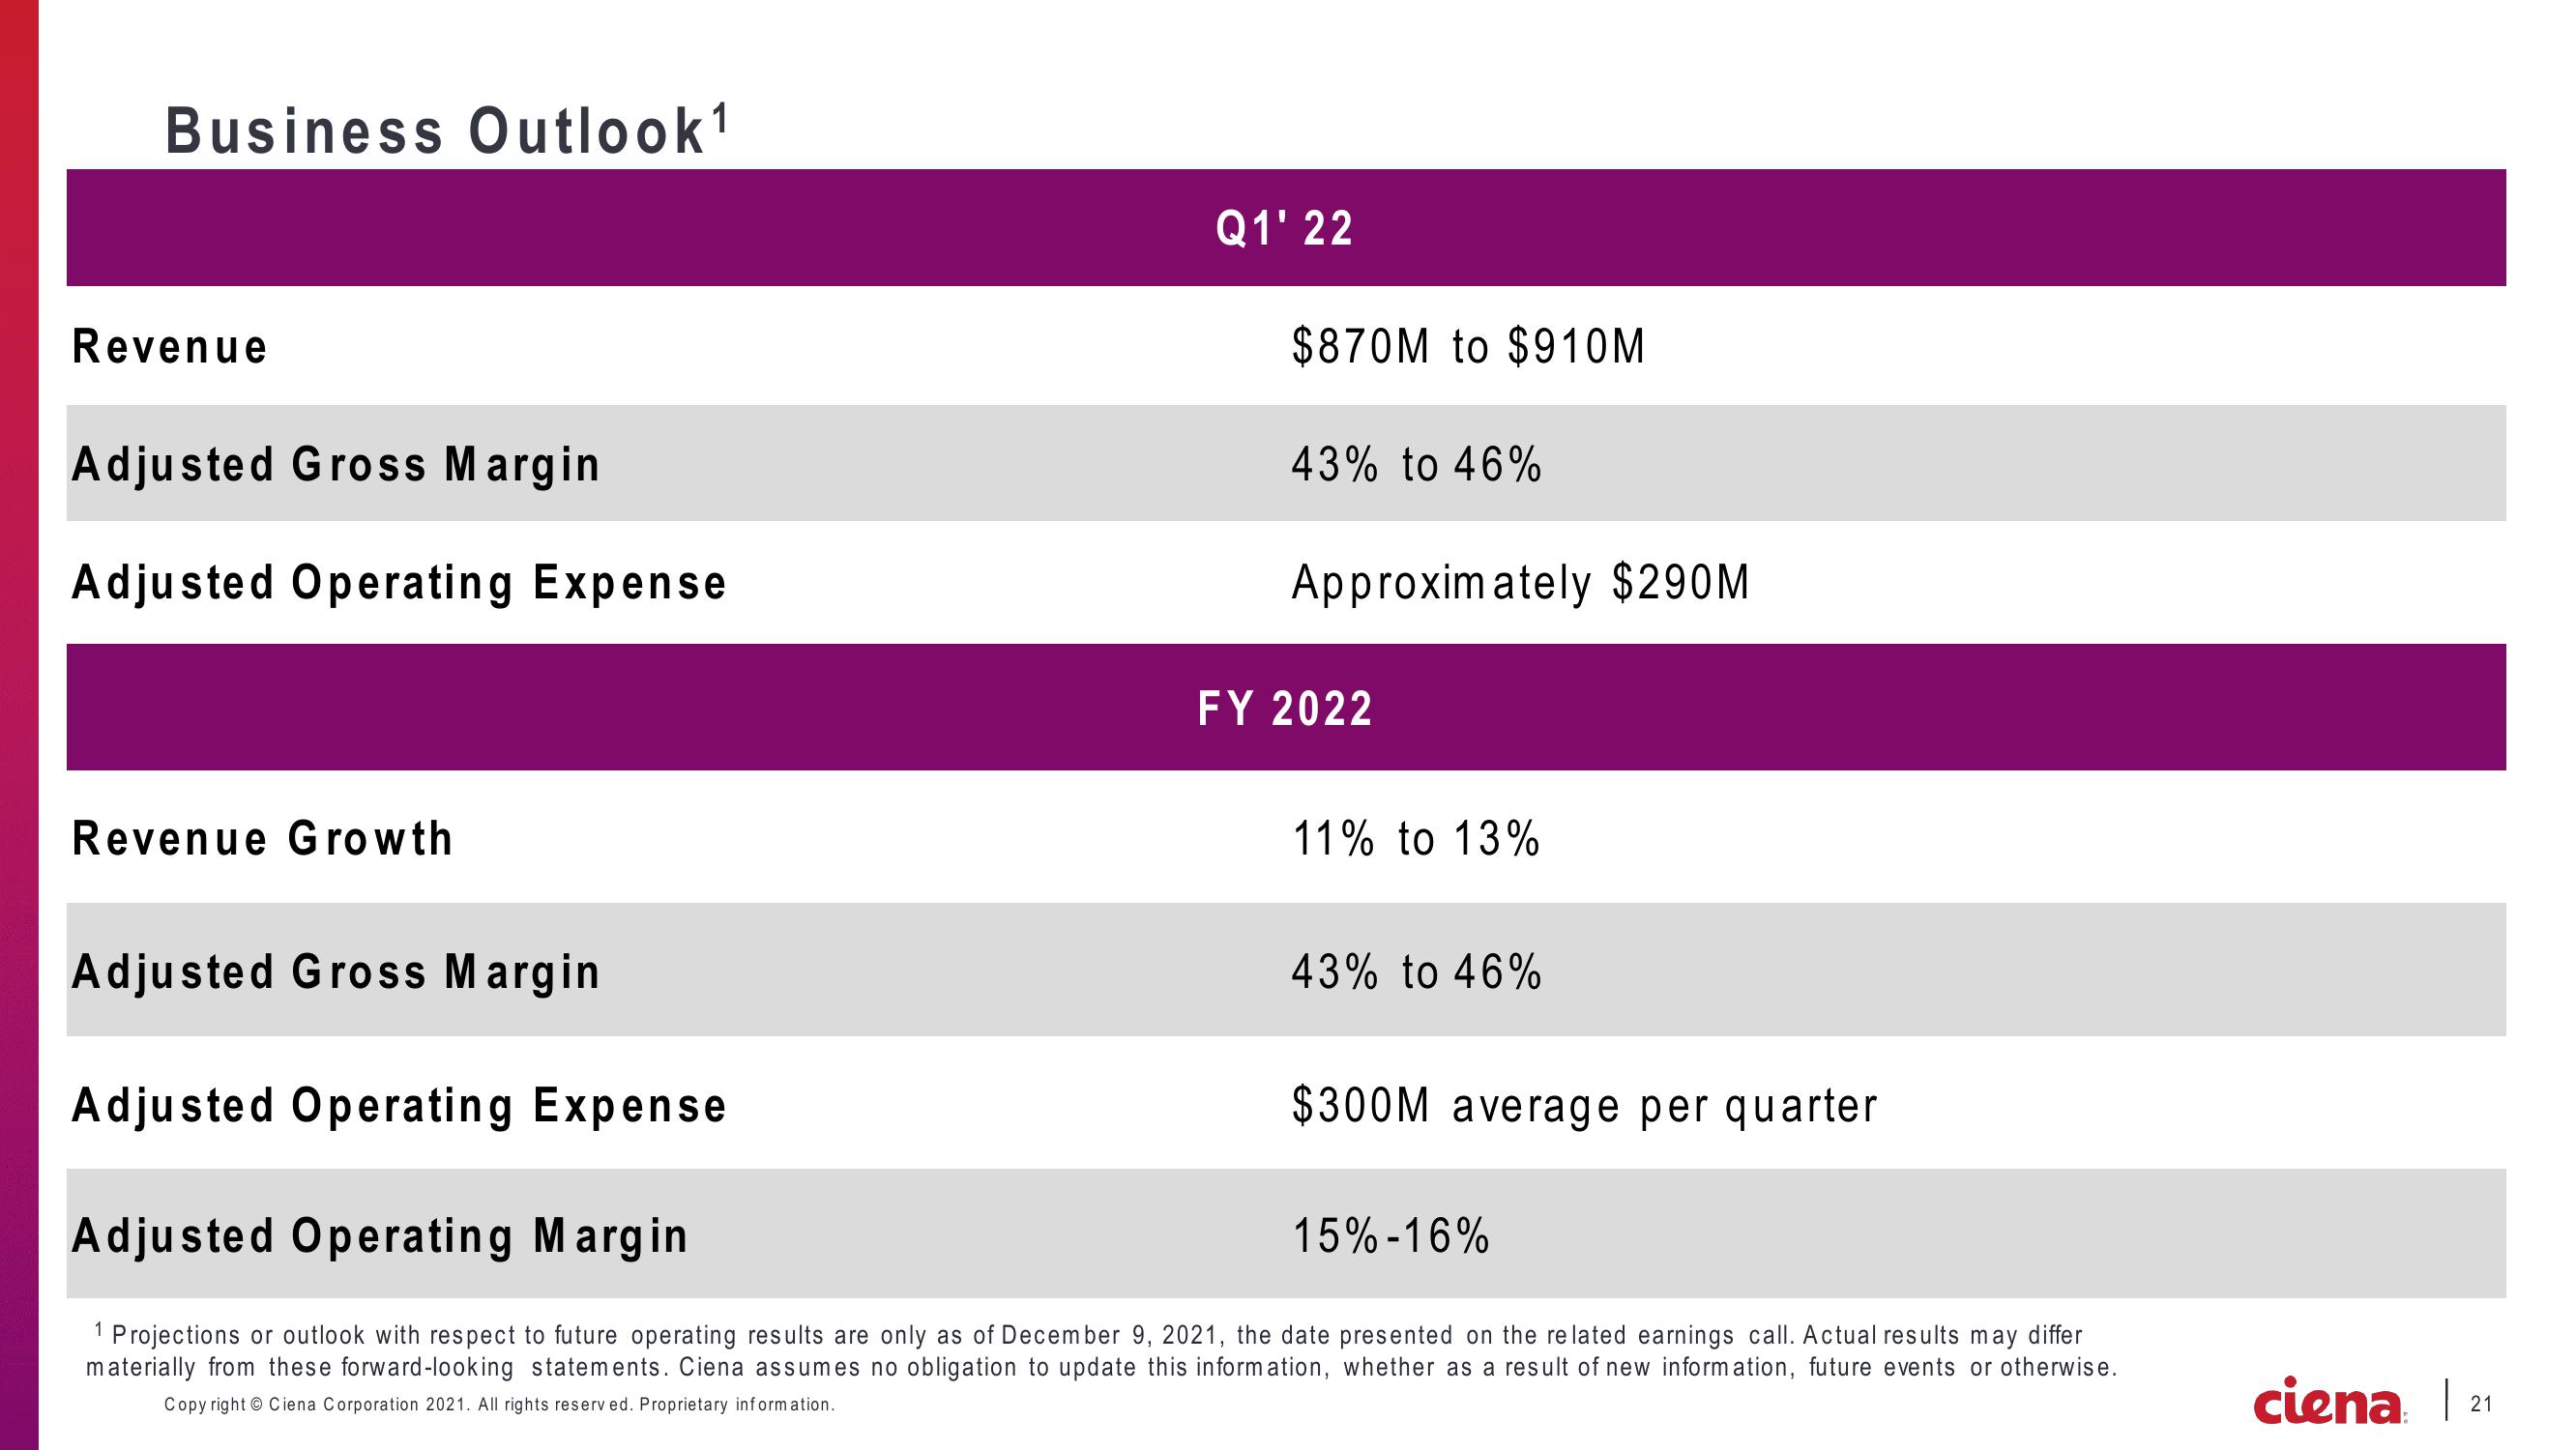
Business Outlook ¹ Revenue Adjusted Gross Margin Adjusted Operating Expense Revenue Growth Adjusted Gross Margin Adjusted Operating Expense Q1' 22 $870M to $910M 43% to 46% Approximately $290M FY 2022 11% to 13% 43% to 46% $300M average per quarter Adjusted Operating Margin 1 Projections or outlook with respect to future operating results are only as of December 9, 2021, the date presented on the related earnings call. Actual results may differ materially from these forward-looking statements. Ciena assumes no obligation to update this information, whether as a result of new information, future events or otherwise. Copyright © Ciena Corporation 2021. All rights reserved. Proprietary information. 15% -16% ciena | 21
View entire presentation