J.P.Morgan Shareholder Engagement Presentation Deck
Notes
NOTES ON NON-GAAP FINANCIAL MEASURES
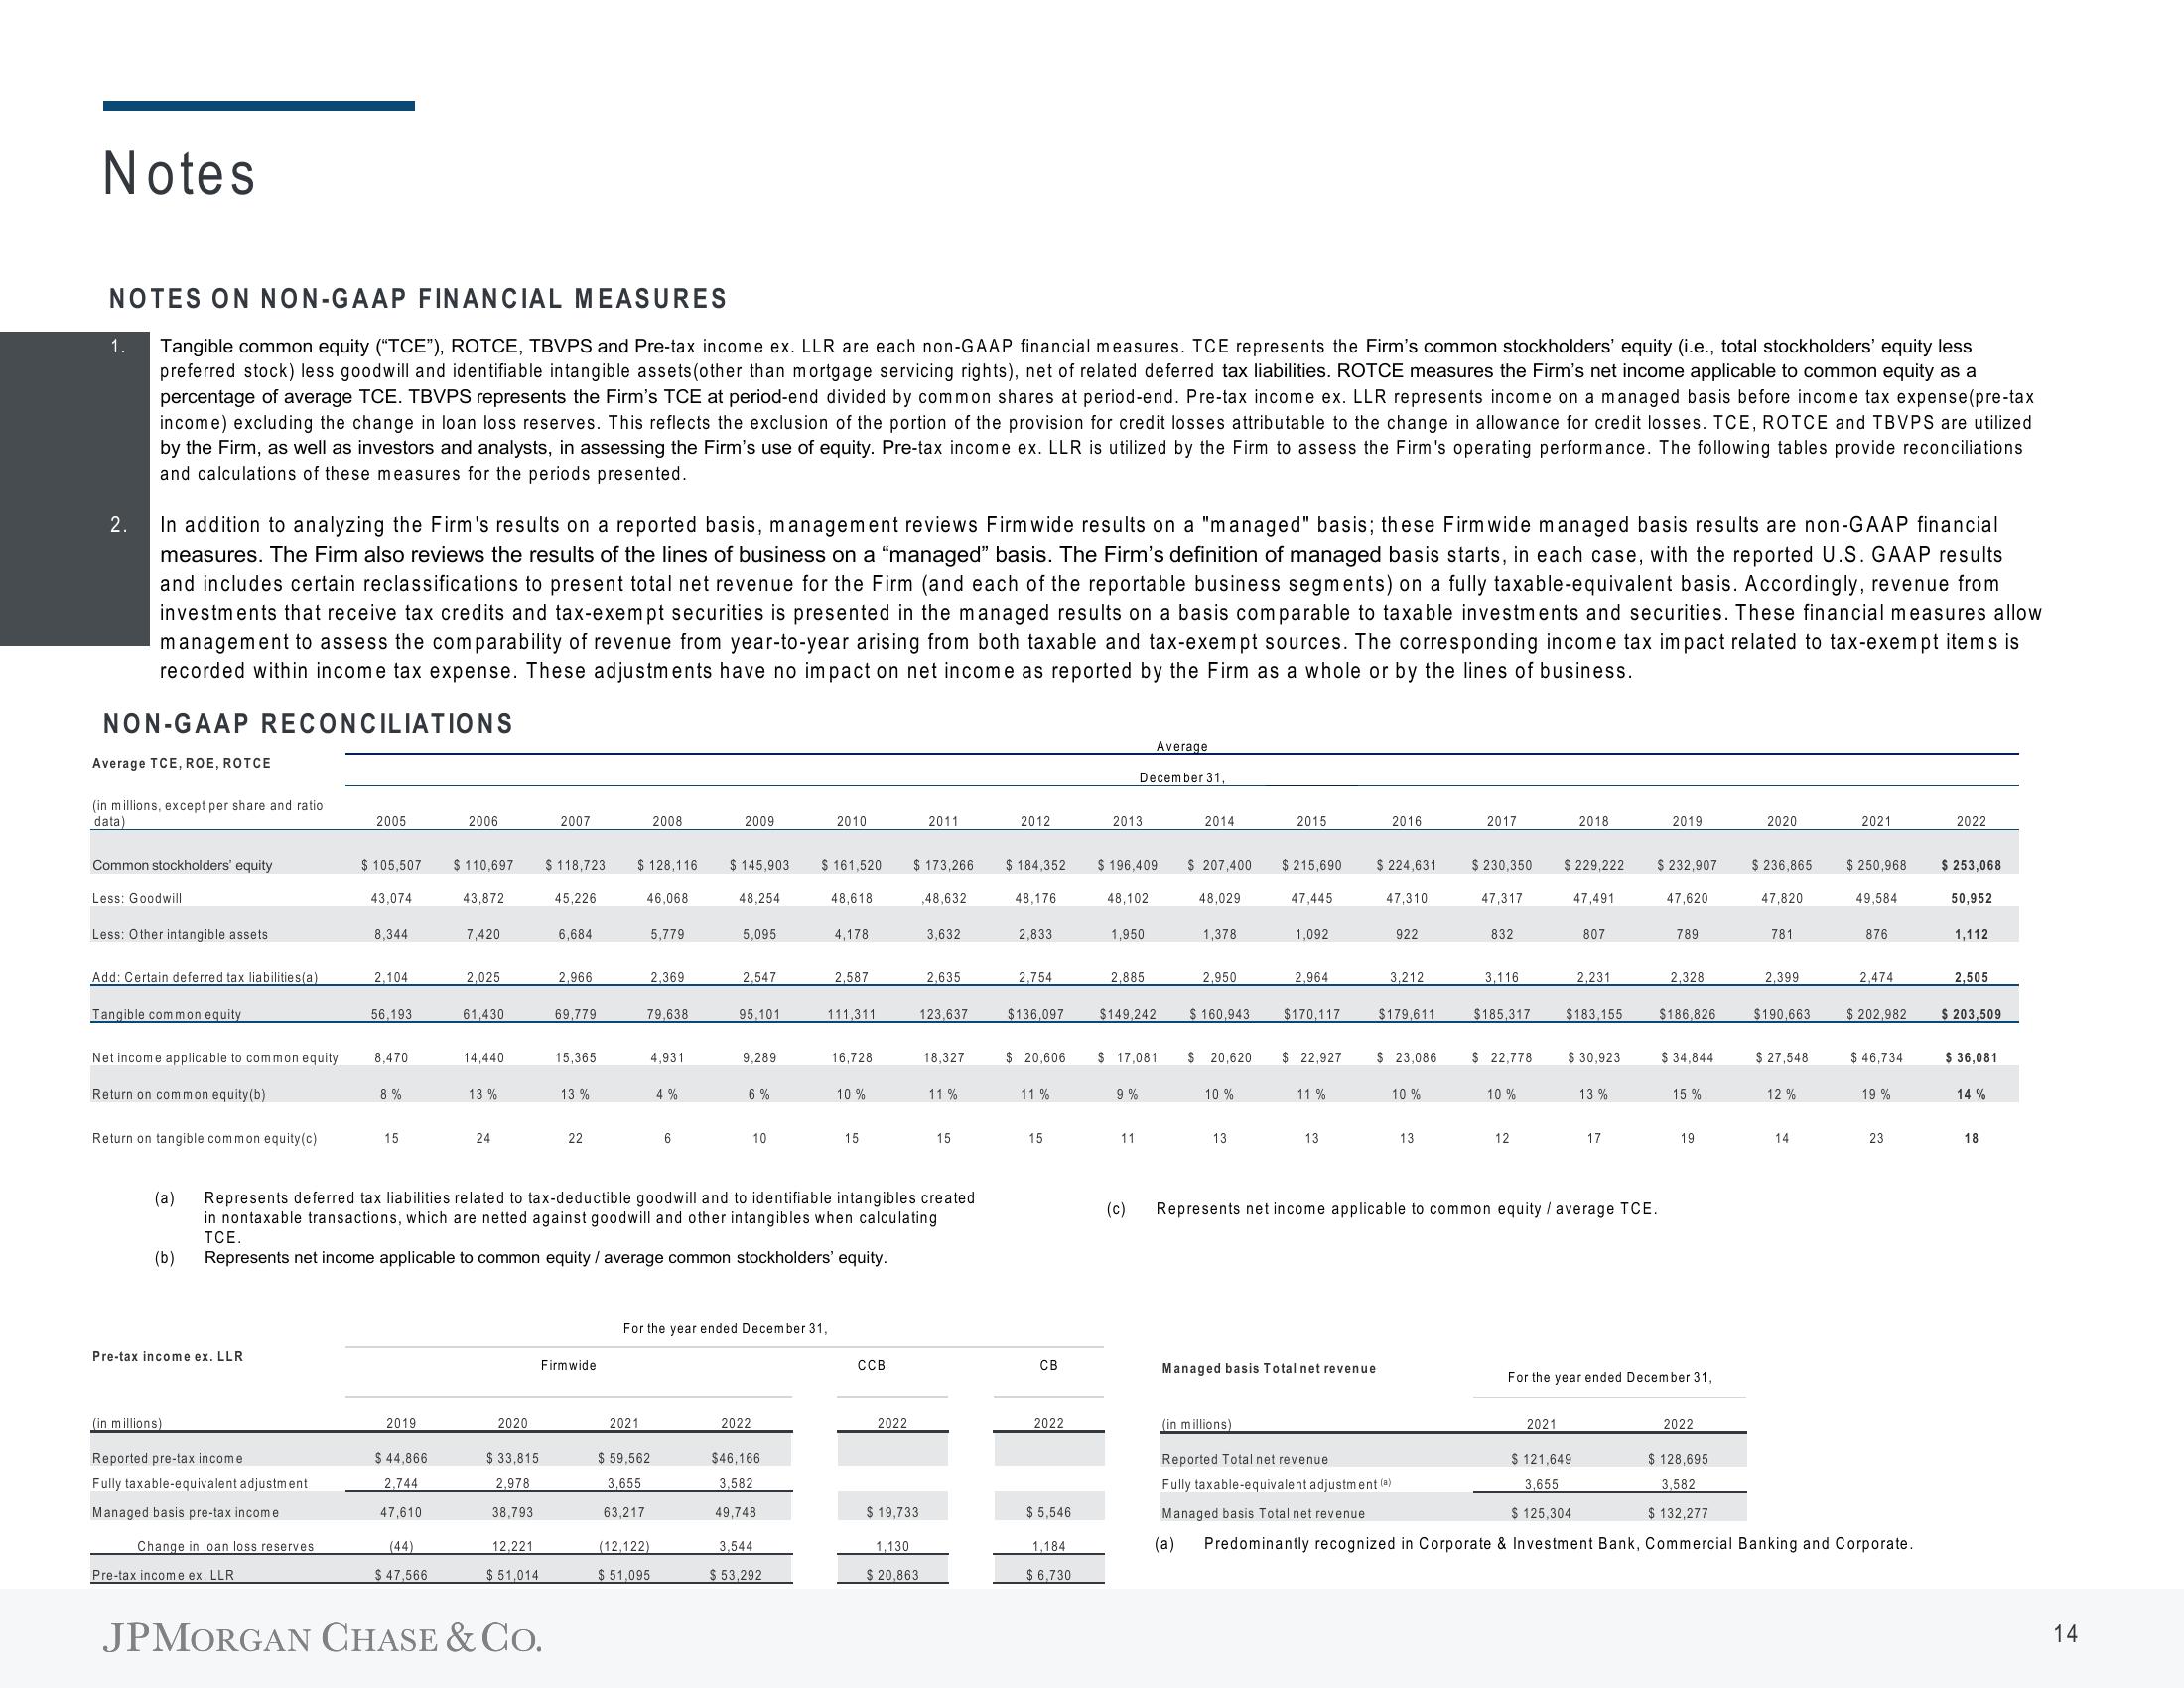
Tangible common equity ("TCE"), ROTCE, TBVPS and Pre-tax income ex. LLR are each non-GAAP financial measures. TCE represents the Firm's common stockholders' equity (i.e., total stockholders' equity less
preferred stock) less goodwill and identifiable intangible assets (other than mortgage servicing rights), net of related deferred tax liabilities. ROTCE measures the Firm's net income applicable to common equity as a
percentage of average TCE. TBVPS represents the Firm's TCE at period-end divided by common shares at period-end. Pre-tax income ex. LLR represents income on a managed basis before income tax expense (pre-tax
income) excluding the change in loan loss reserves. This reflects the exclusion of the portion of the provision for credit losses attributable to the change in allowance for credit losses. TCE, ROTCE and TBVPS are utilized
by the Firm, as well as investors and analysts, in assessing the Firm's use of equity. Pre-tax income ex. LLR is utilized by the Firm to assess the Firm's operating performance. The following tables provide reconciliations
and calculations of these measures for the periods presented.
1.
2.
In addition to analyzing the Firm's results on a reported basis, management reviews Firm wide results on a "managed" basis; these Firm wide managed basis results are non-GAAP financial
measures. The Firm also reviews the results of the lines of business on a "managed" basis. The Firm's definition of managed basis starts, in each case, with the reported U.S. GAAP results
and includes certain reclassifications to present total net revenue for the Firm (and each of the reportable business segments) on a fully taxable-equivalent basis. Accordingly, revenue from
investments that receive tax credits and tax-exempt securities is presented in the managed results on a basis comparable to taxable investments and securities. These financial measures allow
management to assess the comparability of revenue from year-to-year arising from both taxable and tax-exempt sources. The corresponding income tax impact related to tax-exempt items is
recorded within income tax expense. These adjustments have no impact on net income as reported by the Firm as a whole or by the lines of business.
NON-GAAP RECONCILIATIONS
Average TCE, ROE, ROTCE
(in millions, except per share and ratio
data)
Common stockholders' equity
Less: Goodwill
Less: Other intangible assets
Add: Certain deferred tax liabilities(a)
Tangible common equity
Net income applicable to common equity
Return on common equity (b)
Return on tangible common equity(c)
(a)
(b)
Pre-tax income ex. LLR
(in millions)
Reported pre-tax income
Fully taxable-equivalent adjustment
Managed basis pre-tax income
Change in loan loss reserves
2005
Pre-tax income ex. LLR
$ 105,507
43,074
8,344
2,104
56,193
8,470
8%
15
2019
$44,866
2,744
47,610
2006
(44)
$ 47,566
$ 110,697
43,872
7,420
2,025
61,430
14,440
13%
24
2020
$ 33,815
2,978
38,793
12,221
$51,014
2007
$ 118,723 $ 128,116
45,226
JPMORGAN CHASE & CO.
6,684
2,966
69,779
15,365
13%
22
Firmwide
2008
46,068
2021
5,779
2,369
79,638
4,931
$ 59,562
3,655
63,217
(12,122)
$ 51,095
4%
6
2009
$145,903
48,254
5,095
2,547
95,101
9,289
6%
10
For the year ended December 31,
2022
Represents deferred tax liabilities related to tax-deductible goodwill and to identifiable intangibles created
in nontaxable transactions, which are netted against goodwill and other intangibles when calculating
TCE.
Represents net income applicable to common equity / average common stockholders' equity.
$46,166
3,582
49,748
2010
$ 161,520
3,544
$53,292
48,618
4,178
2,587
111,311
16,728
10%
15
CCB
2022
2011
$ 173,266
$19,733
1,130
$ 20,863
,48,632
3,632
2,635
123,637
18,327
11%
15
2012
$ 184,352
48,176
2,833
2,754
$136.097
$ 20,606
11%
15
CB
2022
$5,546
1,184
$6,730
2013
Average
December 31,
$ 196,409
48,102
1,950
2,885
$149,242
$ 17,081
9%
11
2014
$ 207,400
48,029
1,378
2,950
$ 160,943
$ 20,620
10%
13
2015
$215,690
47,445
1,092
2,964
$170,117
$ 22,927
11%
13
2016
$ 224,631
47,310
Managed basis Total net revenue
922
3,212
$179,611
$ 23,086
10%
13
2017
$ 230,350
47,317
832
3,116
$185,317
$ 22,778
10 %
12
2018
$ 229,222
2021
47,491
807
2,231
$183,155
$ 30,923
$ 121,649
3,655
$ 125,304
13 %
17
(c) Represents net income applicable to common equity / average TCE.
2019
$ 232,907
47,620
789
2,328
$186,826
$ 34,844
15%
For the year ended December 31,
19
2020
2022
$ 236,865
47,820
781
2,399
$190,663
$ 27,548
12%
14
2021
$ 250,968
49,584
876
2,474
$ 202,982
$46,734
(in millions)
Reported Total net revenue
$ 128,695
3,582
Fully taxable-equivalent adjustment (a)
Managed basis Total net revenue
$ 132,277
(a) Predominantly recognized in Corporate & Investment Bank, Commercial Banking and Corporate.
19 %
23
2022
$ 253,068
50,952
1,112
2,505
$ 203,509
$ 36,081
14%
18
14View entire presentation