Rightmove Results Presentation Deck
32
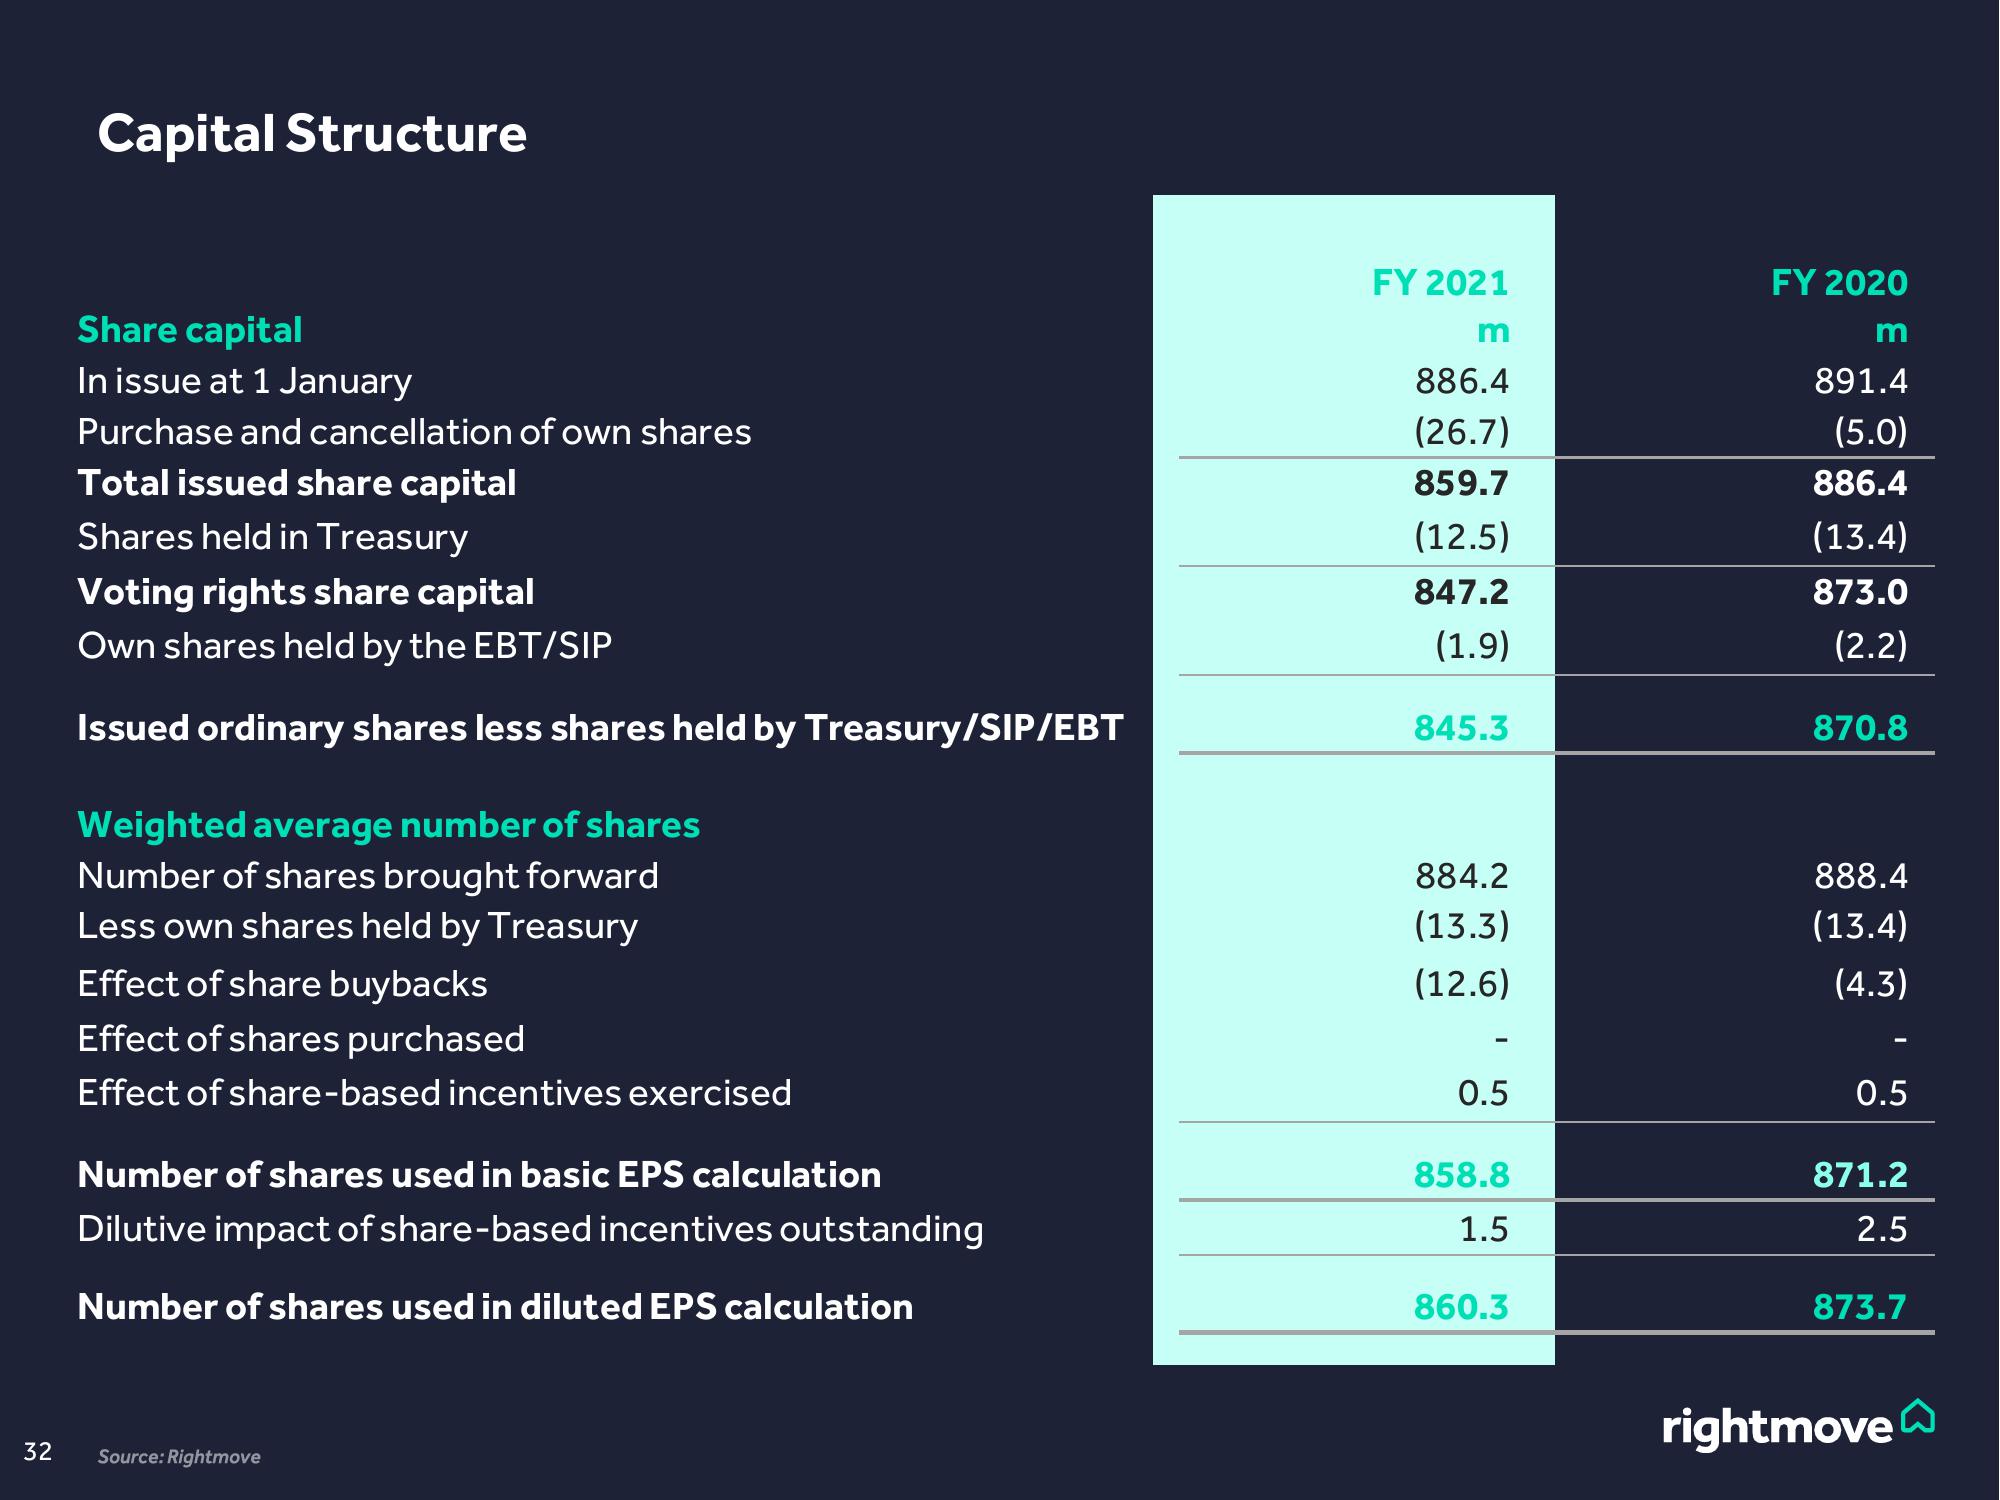
Capital Structure
Share capital
In issue at 1 January
Purchase and cancellation of own shares
Total issued share capital
Shares held in Treasury
Voting rights share capital
Own shares held by the EBT/SIP
Issued ordinary shares less shares held by Treasury/SIP/EBT
Weighted average number of shares
Number of shares brought forward
Less own shares held by Treasury
Effect of share buybacks
Effect of shares purchased
Effect of share-based incentives exercised
Number of shares used in basic EPS calculation
Dilutive impact of share-based incentives outstanding
Number of shares used in diluted EPS calculation
Source: Rightmove
FY 2021
m
886.4
(26.7)
859.7
(12.5)
847.2
(1.9)
845.3
884.2
(13.3)
(12.6)
0.5
858.8
1.5
860.3
FY 2020
m
891.4
(5.0)
886.4
(13.4)
873.0
(2.2)
870.8
888.4
(13.4)
(4.3)
0.5
871.2
2.5
873.7
rightmoveView entire presentation