Ashtead Group Results Presentation Deck
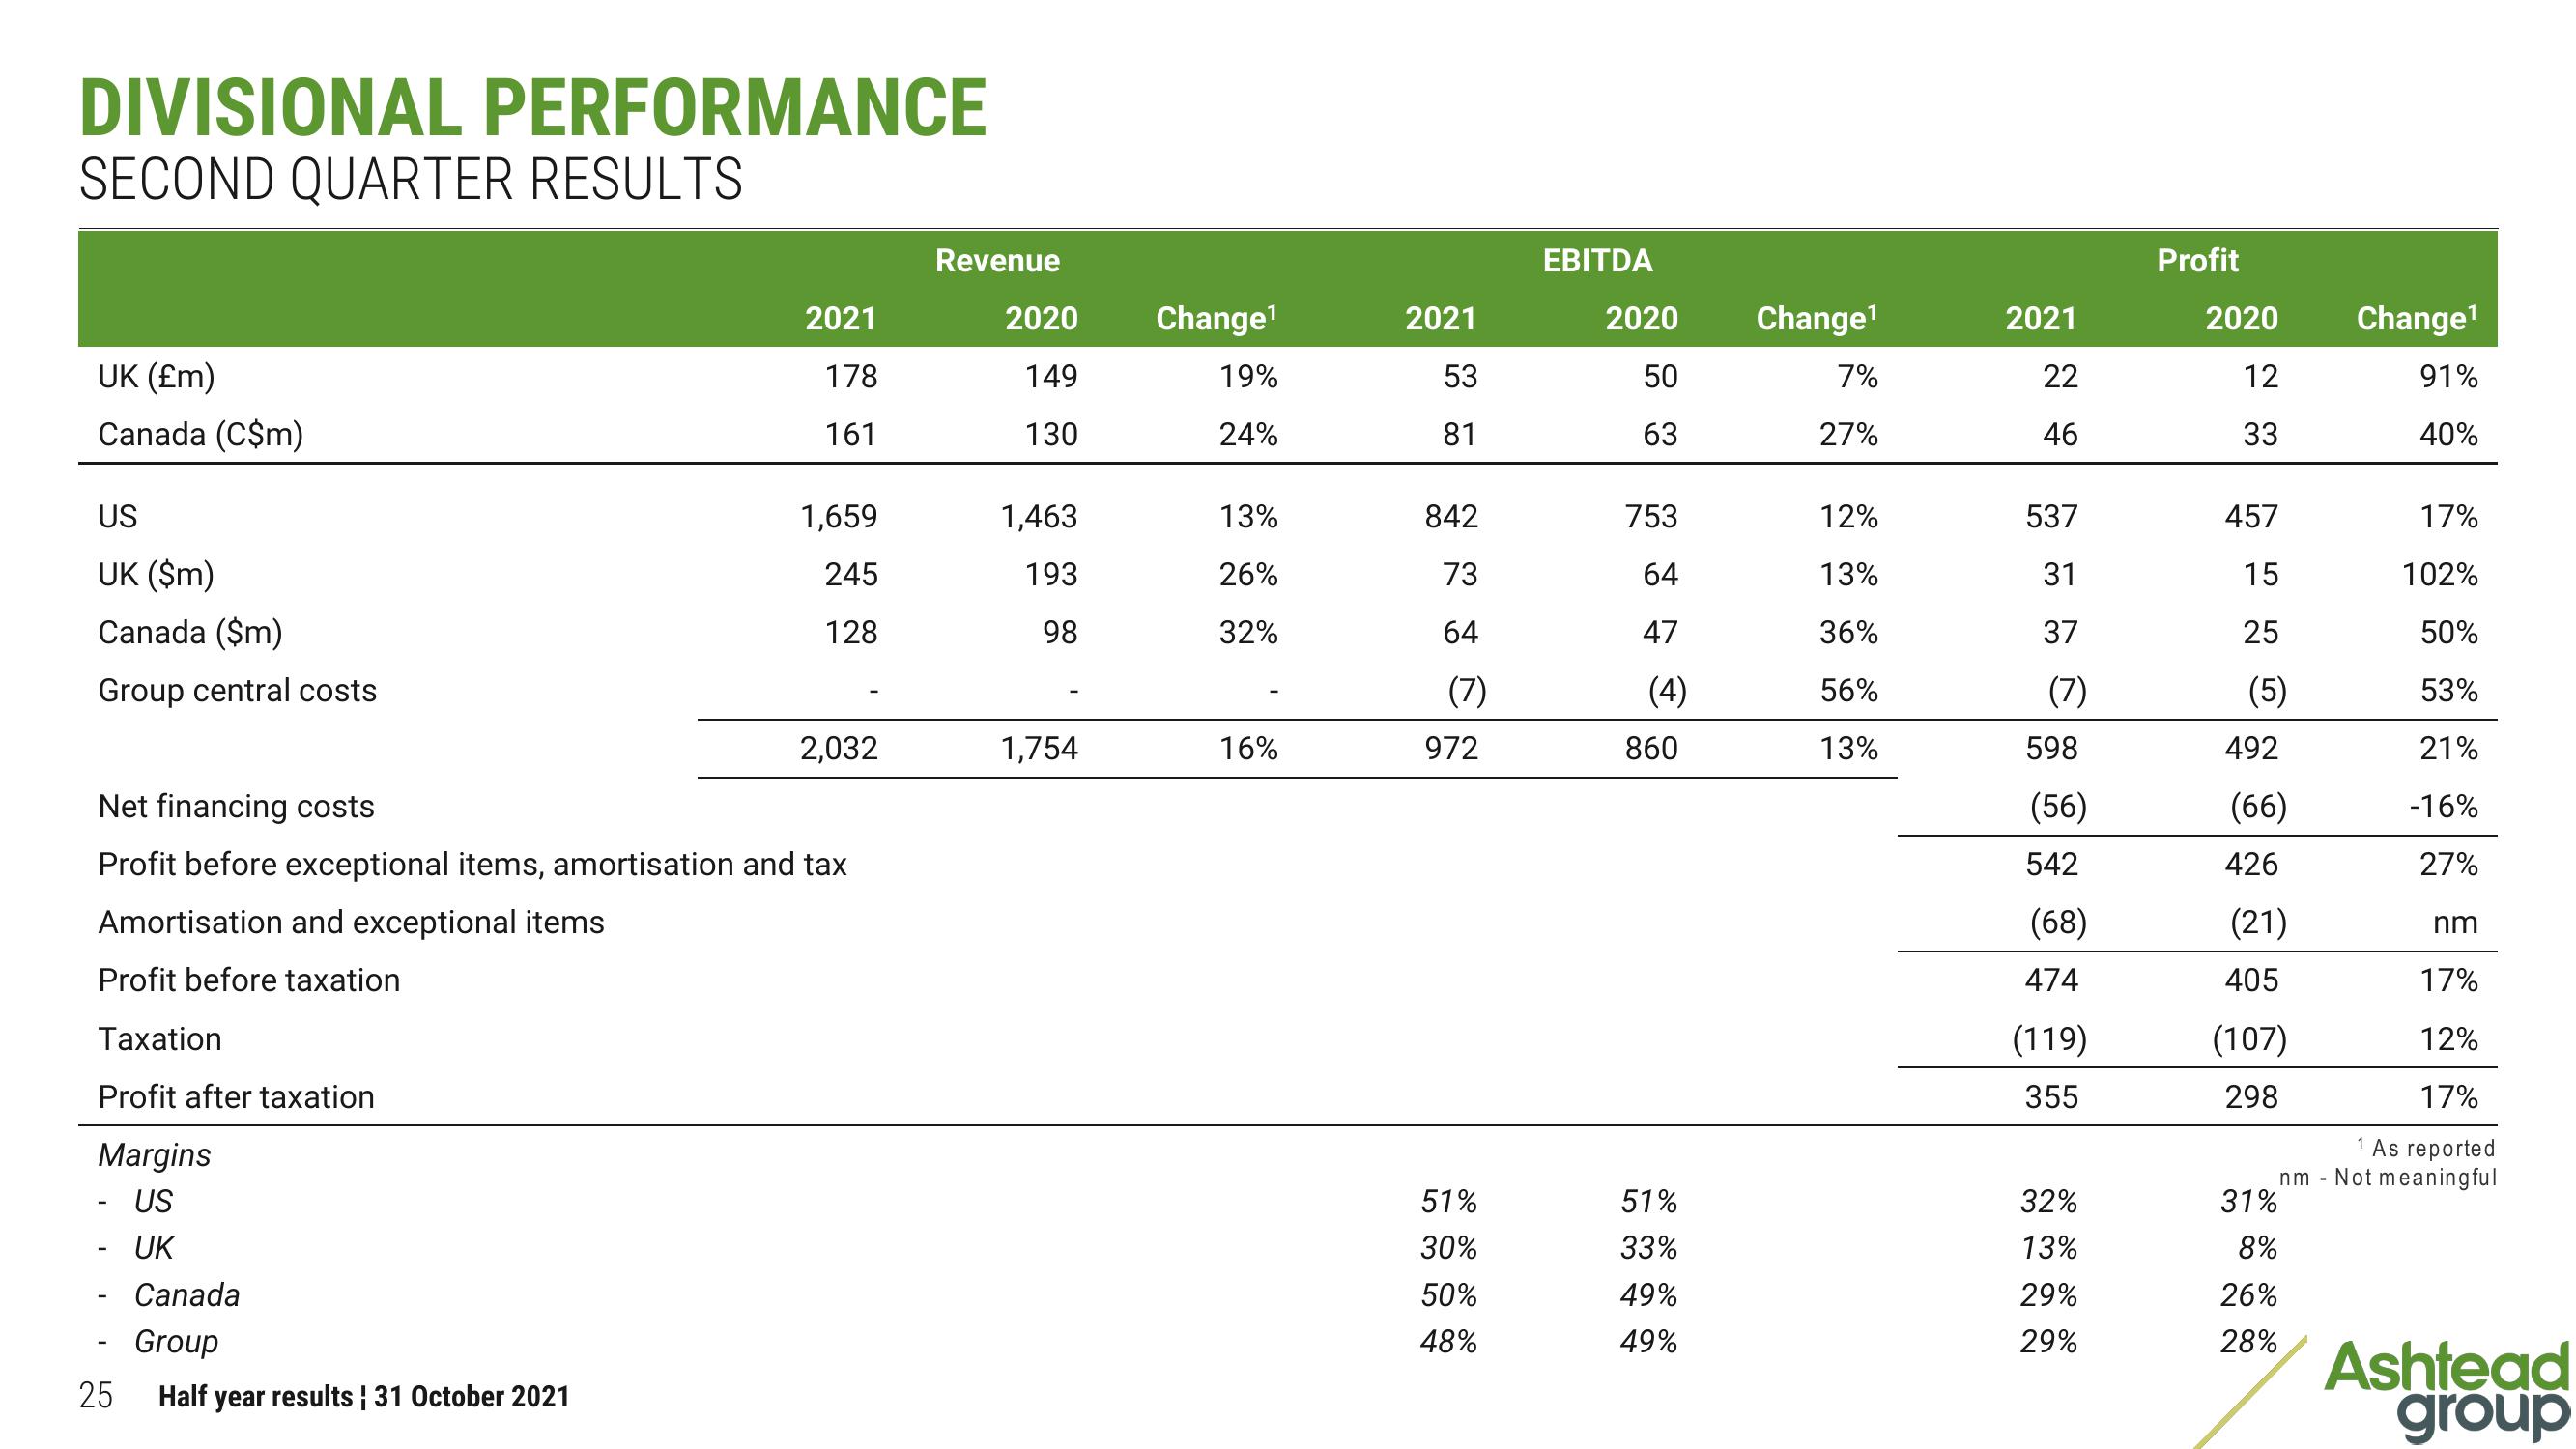
DIVISIONAL PERFORMANCE
SECOND QUARTER RESULTS
UK (£m)
Canada (C$m)
US
UK ($m)
Canada ($m)
Group central costs
Amortisation and exceptional items
Profit before taxation
Taxation
Profit after taxation
Margins
- US
UK
25
2021
178
161
Net financing costs
Profit before exceptional items, amortisation and tax
Canada
Group
Half year results | 31 October 2021
1,659
245
128
2,032
Revenue
2020
149
130
1,463
193
98
1,754
Change¹
19%
24%
13%
26%
32%
16%
2021
53
81
842
73
64
(7)
972
51%
30%
50%
48%
EBITDA
2020
50
63
753
64
47
(4)
860
51%
33%
49%
49%
Change¹
7%
27%
12%
13%
36%
56%
13%
2021
22
46
537
31
37
(7)
598
(56)
542
(68)
474
(119)
355
32%
13%
29%
29%
Profit
2020
12
33
457
15
25
(5)
492
(66)
426
(21)
405
(107)
298
31%
8%
26%
28%
Change¹
91%
40%
17%
102%
50%
53%
21%
-16%
27%
nm
17%
12%
17%
1 As reported
nm - Not meaningful
Ashtead
groupView entire presentation