Equillium Results Presentation Deck
Key Demographics
equillium
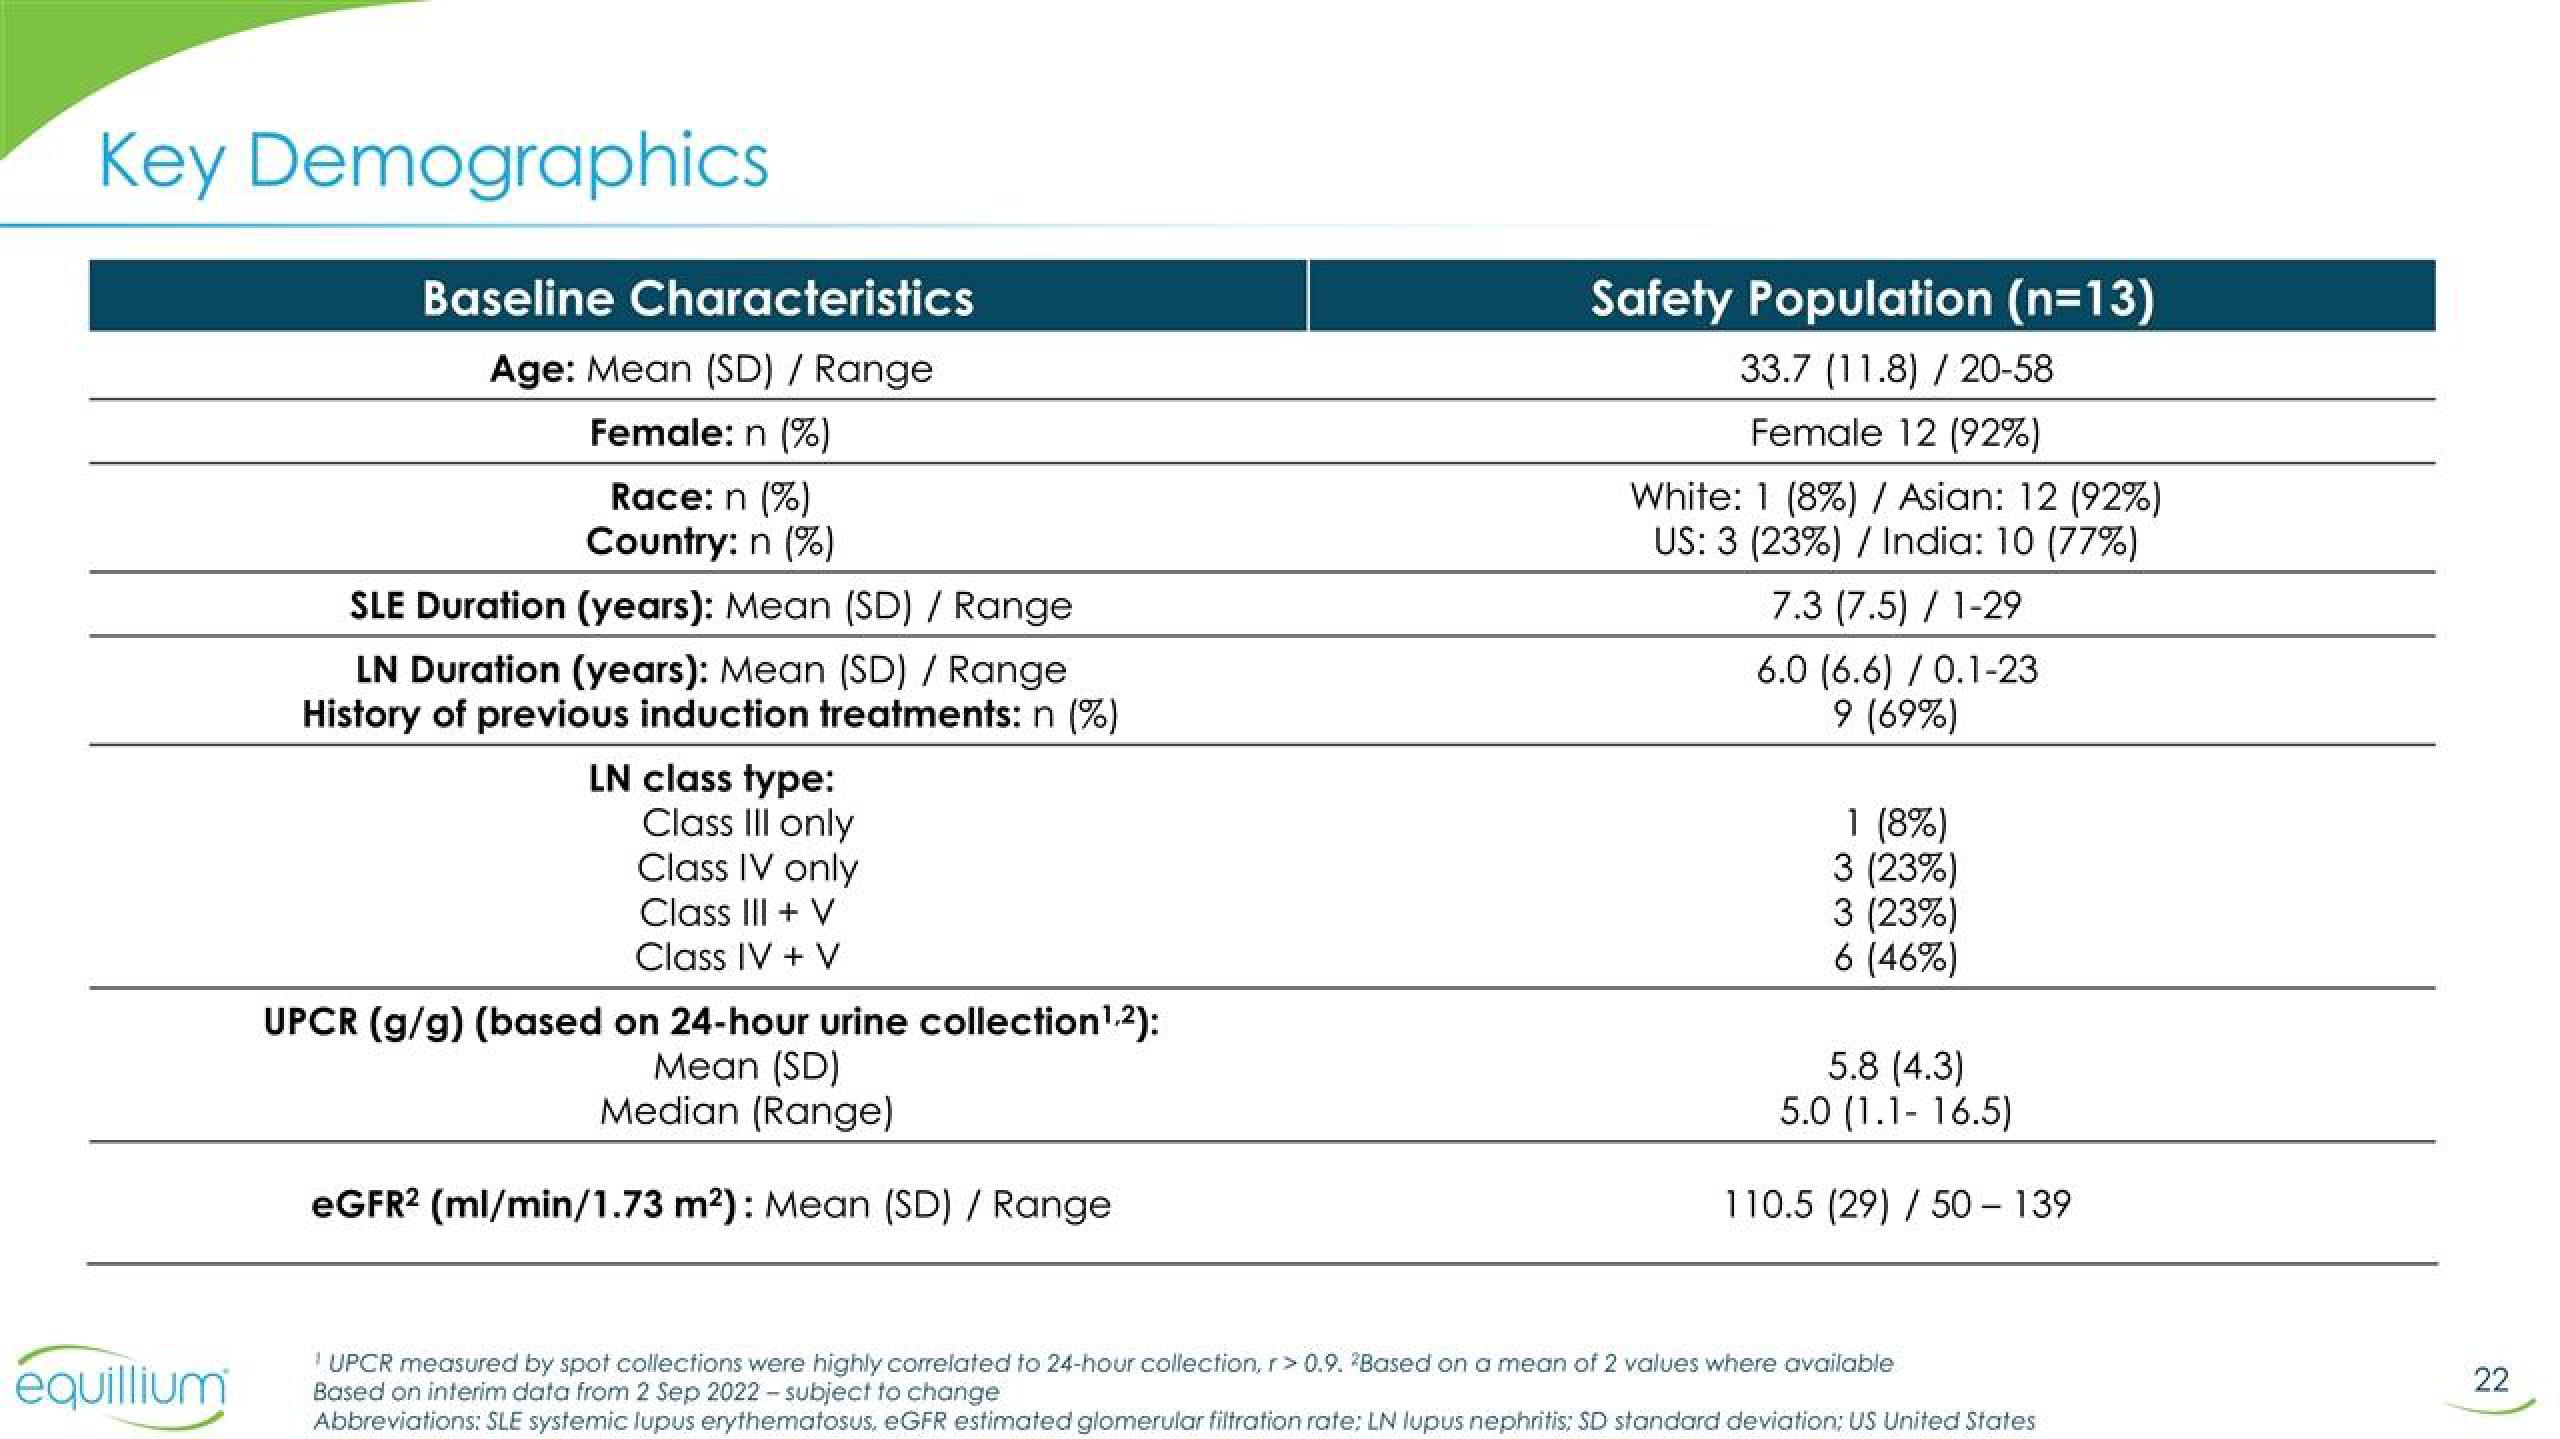
Baseline Characteristics
Age: Mean (SD) / Range
Female: n (%)
Race: n (%)
Country: n (%)
SLE Duration (years): Mean (SD) / Range
LN Duration (years): Mean (SD) / Range
History of previous induction treatments: n (%)
LN class type:
Class III only
Class IV only
Class III + V
Class IV + V
UPCR (g/g) (based on 24-hour urine collection ¹.2):
Mean (SD)
Median (Range)
eGFR2 (ml/min/1.73 m²): Mean (SD) / Range
Safety Population (n=13)
33.7 (11.8) / 20-58
Female 12 (92%)
White: 1 (8%) / Asian: 12 (92%)
US: 3 (23%) / India: 10 (77%)
7.3 (7.5) / 1-29
6.0 (6.6) / 0.1-23
9 (69%)
1 (8%)
3 (23%)
3 (23%)
6 (46%)
5.8 (4.3)
5.0 (1.1- 16.5)
110.5 (29) / 50 - 139
UPCR measured by spot collections were highly correlated to 24-hour collection, r> 0.9. Based on a mean of 2 values where available
Based on interim data from 2 Sep 2022-subject to change
Abbreviations: SLE systemic lupus erythematosus, eGFR estimated glomerular filtration rate: LN lupus nephritis: SD standard deviation: US United States
22View entire presentation