SoftBank Results Presentation Deck
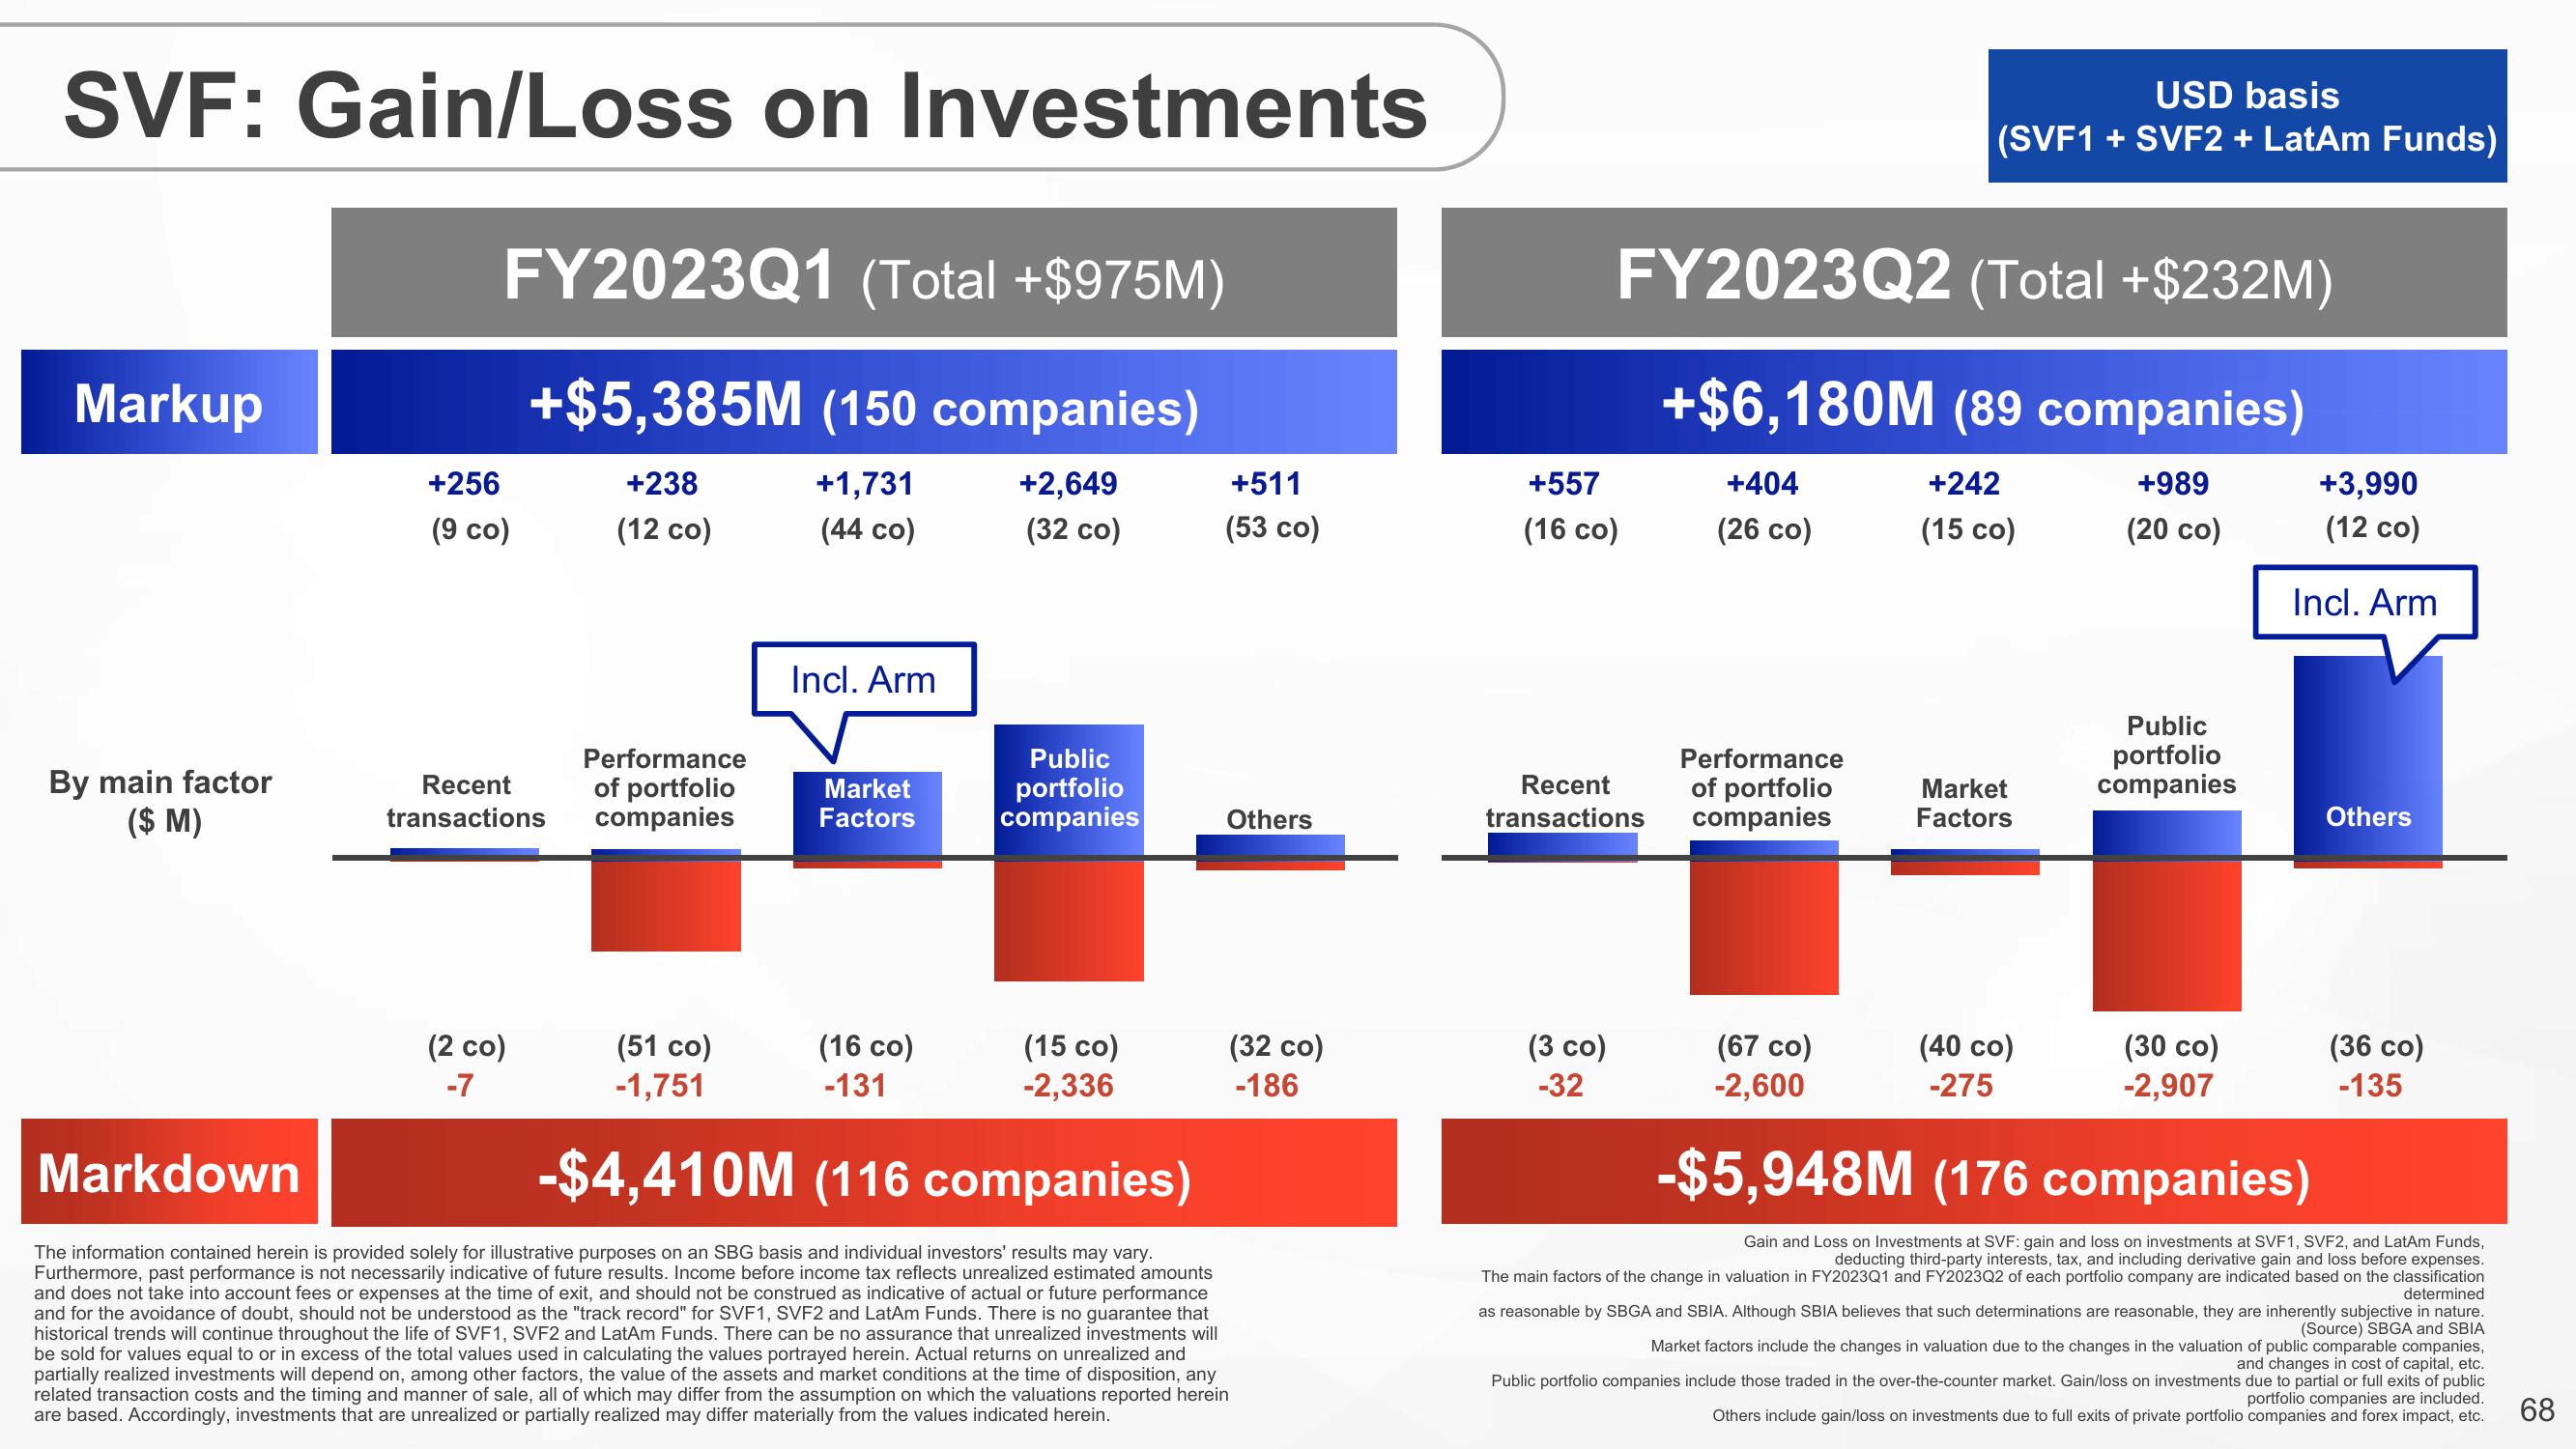
SVF: Gain/Loss on Investments
Markup
By main factor
($ M)
FY2023Q1 (Total +$975M)
+$5,385M (150 companies)
+2,649
(32 co)
+256
(9 co)
Recent
transactions
(2 co)
-7
+238
(12 co)
Performance
of portfolio
companies
(51 co)
-1,751
+1,731
(44 co)
Incl. Arm
Market
Factors
(16 co)
-131
Public
portfolio
companies
(15 co)
-2,336
+511
(53 co)
Others
(32 co)
-186
Markdown
-$4,410M (116 companies)
The information contained herein is provided solely for illustrative purposes on an SBG basis and individual investors' results may vary.
Furthermore, past performance is not necessarily indicative of future results. Income before income tax reflects unrealized estimated amounts
and does not take into account fees or expenses at the time of exit, and should not be construed as indicative of actual or future performance
and for the avoidance of doubt, should not be understood as the "track record" for SVF1, SVF2 and LatAm Funds. There is no guarantee that
historical trends will continue throughout the life of SVF1, SVF2 and LatAm Funds. There can be no assurance that unrealized investments will
be sold for values equal to or in excess of the total values used in calculating the values portrayed herein. Actual returns on unrealized and
partially realized investments will depend on, among other factors, the value of the assets and market conditions at the time of disposition, any
related transaction costs and the timing and manner of sale, all of which may differ from the assumption on which the valuations reported herein
are based. Accordingly, investments that are unrealized or partially realized may differ materially from the values indicated herein.
+557
(16 co)
FY2023Q2 (Total +$232M)
+$6,180M (89 companies)
+989
(20 co)
Recent
transactions
(3 co)
-32
+404
(26 co)
Performance
of portfolio
companies
USD basis
(SVF1 + SVF2 + LatAm Funds)
(67 co)
-2,600
+242
(15 co)
Market
Factors
(40 co)
-275
Public
portfolio
companies
(30 co)
-2,907
+3,990
(12 co)
Incl. Arm
-$5,948M (176 companies)
Others
(36 co)
-135
Gain and Loss on Investments at SVF: gain and loss on investments at SVF1, SVF2, and LatAm Funds,
deducting third-party interests, tax, and including derivative gain and loss before expenses.
The main factors of the change in valuation in FY2023Q1 and FY2023Q2 of each portfolio company are indicated based on the classification
determined
as reasonable by SBGA and SBIA. Although SBIA believes that such determinations are reasonable, they are inherently subjective in nature.
(Source) SBGA and SBIA
Market factors include the changes in valuation due to the changes in the valuation of public comparable companies,
and changes in cost of capital, etc.
Public portfolio companies include those traded in the over-the-counter market. Gain/loss on investments due to partial or full exits of public
portfolio companies are included.
Others include gain/loss on investments due to full exits of private portfolio companies and forex impact, etc.
68View entire presentation