IBEX Results Presentation Deck
ibex.
US$ in thousands, except per share amounts, unaudited
Revenue
Cost of services
Selling, general and administrative
Depreciation and amortization
Total operating expenses
Income from operations
Interest income
Interest expense
Income before income taxes
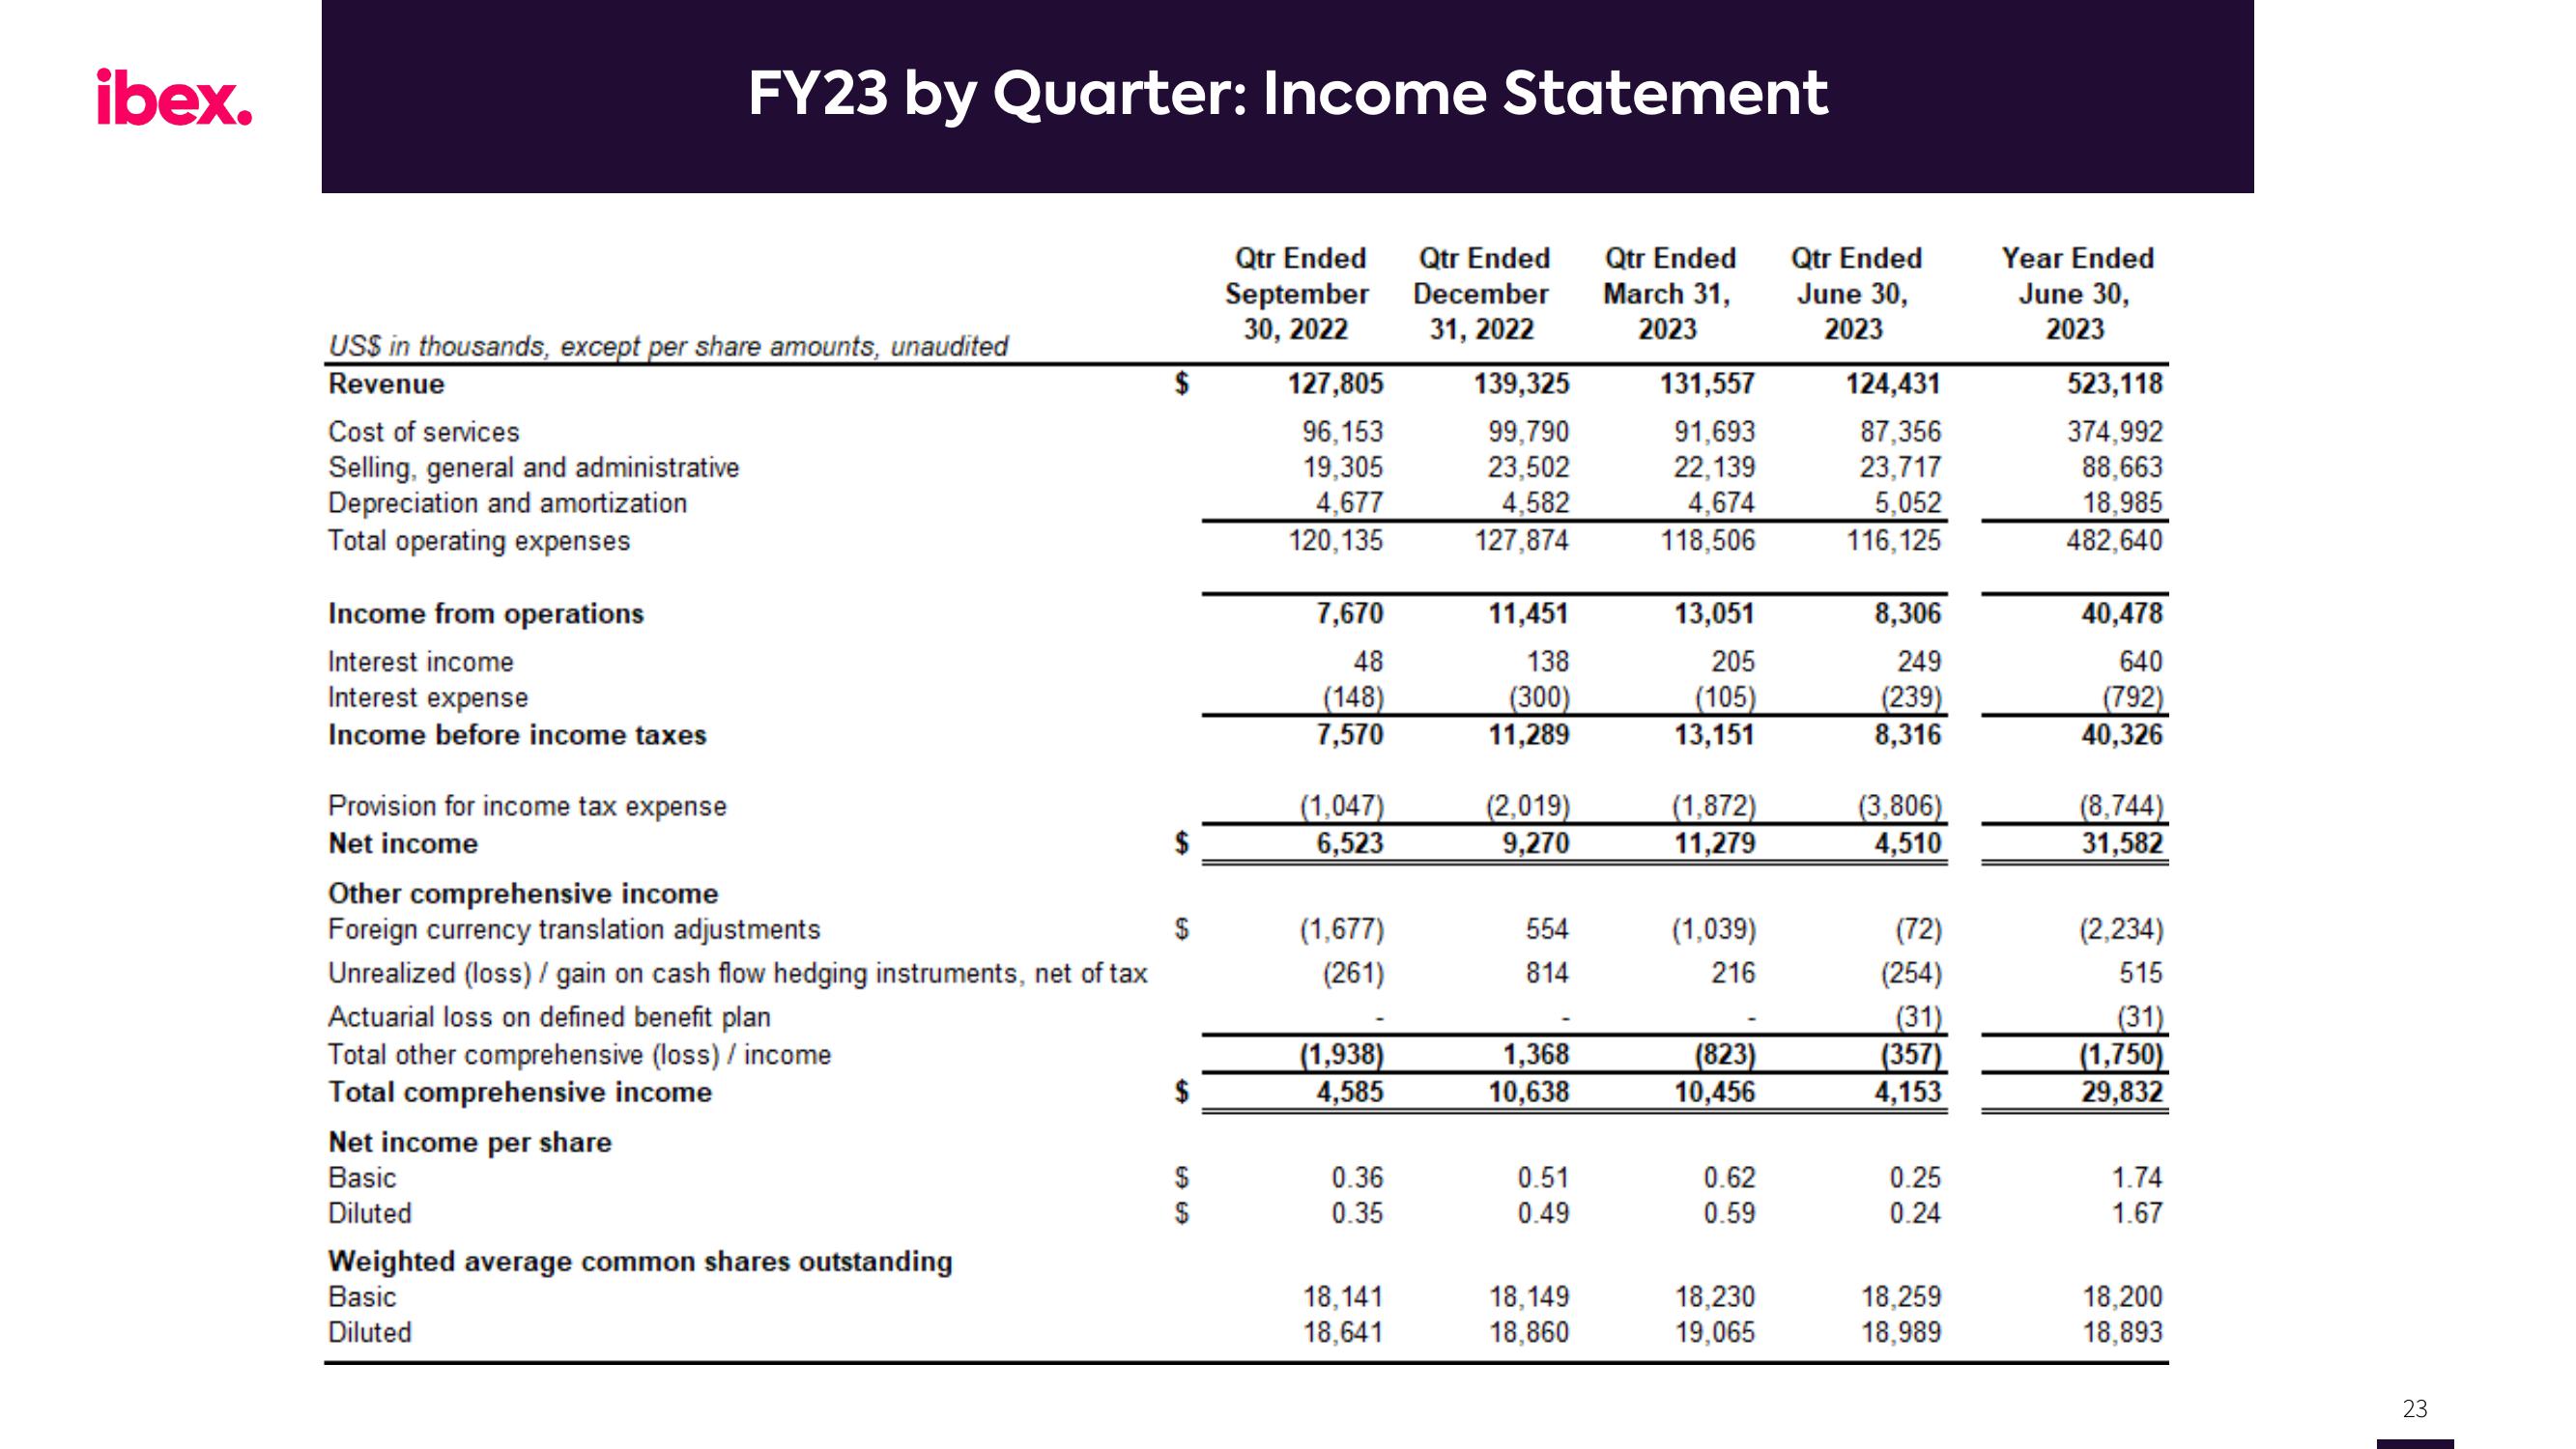
FY23 by Quarter: Income Statement
Provision for income tax expense
Net income
Other comprehensive income
Foreign currency translation adjustments
Unrealized (loss) / gain on cash flow hedging instruments, net of tax
Actuarial loss on defined benefit plan
Total other comprehensive (loss) / income
Total comprehensive income
Net income per share
Basic
Diluted
Weighted average common shares outstanding
Basic
Diluted
69 69
Qtr Ended Qtr Ended
September December
30, 2022 31, 2022
127,805
96,153
19,305
4,677
120,135
7,670
48
(148)
7,570
(1,047)
6,523
(1,677)
(261)
(1,938)
4,585
0.36
0.35
18,141
18,641
139,325
99,790
23,502
4,582
127,874
11,451
138
(300)
11,289
(2,019)
9,270
554
814
1,368
10,638
0.51
0.49
18,149
18,860
Qtr Ended
March 31,
2023
131,557
91,693
22,139
4,674
118,506
13,051
205
(105)
13,151
(1,872)
11,279
(1,039)
216
(823)
10,456
0.62
0.59
18,230
19,065
Qtr Ended
June 30,
2023
124,431
87,356
23,717
5,052
116,125
8,306
249
(239)
8,316
(3,806)
4,510
(72)
(254)
(31)
(357)
4,153
0.25
0.24
18,259
18,989
Year Ended
June 30,
2023
523,118
374,992
88,663
18,985
482,640
40,478
640
(792)
40,326
(8,744)
31,582
(2,234)
515
(31)
(1,750)
29,832
1.74
1.67
18,200
18,893
23View entire presentation