GlobalFoundries Results Presentation Deck
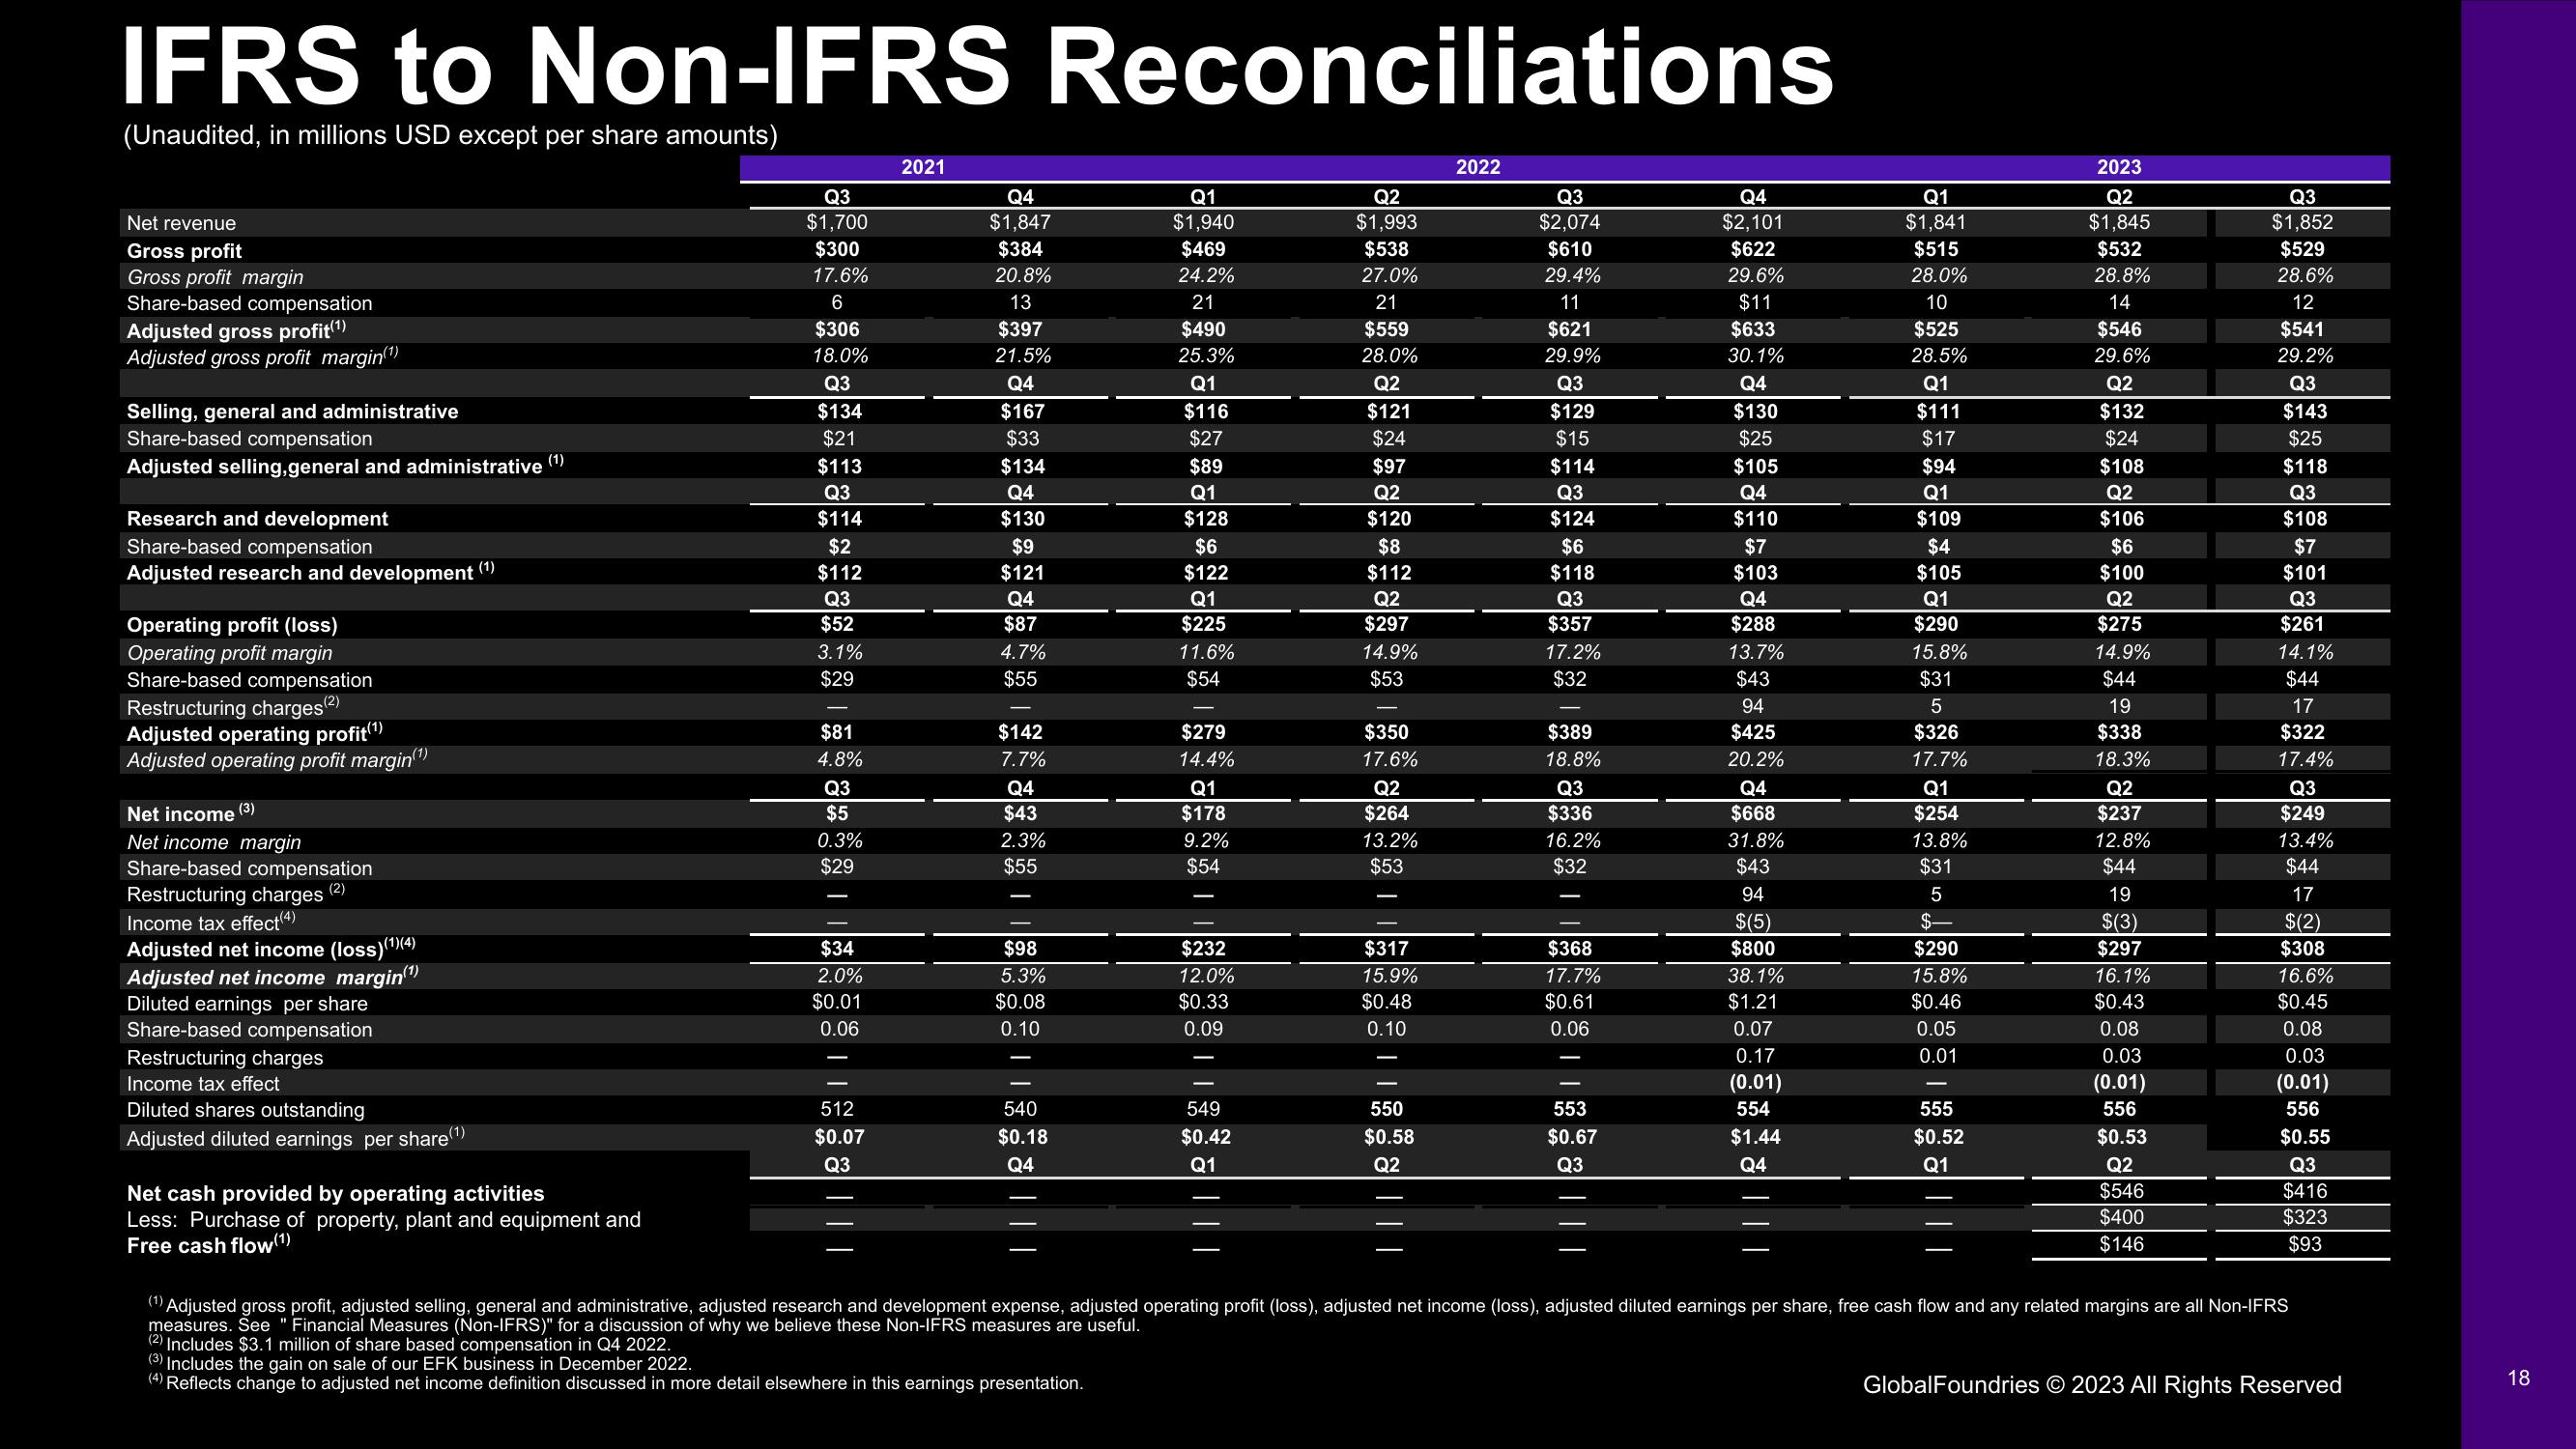
IFRS to Non-IFRS Reconciliations
(Unaudited, in millions USD except per share amounts)
Net revenue
Gross profit
Gross profit margin
Share-based compensation
Adjusted gross profit(¹)
Adjusted gross profit margin(¹)
Selling, general and administrative
Share-based compensation
Adjusted selling,general and administrative
Research and development
Share-based compensation
Adjusted research and development (1)
Operating profit (loss)
Operating profit margin
Share-based compensation
Restructuring charges(²)
Adjusted operating profit (¹)
Adjusted operating profit margin(¹)
Net income (3)
Net income margin
Share-based compensation
(2)
Restructuring charges
Income tax effect(4)
Adjusted net income (loss)(¹)(4)
Adjusted net income margin(¹)
Diluted earnings per share
Share-based compensation
Restructuring charges
Income tax effect
Diluted shares outstanding
Adjusted diluted earnings per share(1)
(1)
Net cash provided by operating activities
Less: Purchase of property, plant and equipment and
Free cash flow (1)
Q3
$1,700
$300
17.6%
6
$306
18.0%
Q3
$134
$21
$113
Q3
$114
$2
$112
Q3
$52
3.1%
$29
$81
4.8%
Q3
$5
0.3%
$29
$34
2.0%
$0.01
0.06
512
$0.07
Q3
2021
Q4
$1,847
$384
20.8%
13
$397
21.5%
Q4
$167
$33
$134
Q4
$130
$9
$121
Q4
$87
4.7%
$55
$142
7.7%
Q4
$43
2.3%
$55
$98
5.3%
$0.08
0.10
540
$0.18
Q4
Q1
$1,940
$469
24.2%
21
$490
25.3%
Q1
$116
$27
$89
Q1
$128
$6
$122
Q1
$225
11.6%
$54
$279
14.4%
Q1
$178
9.2%
$54
I
$232
12.0%
$0.33
0.09
549
$0.42
Q1
Q2
$1,993
$538
27.0%
21
$559
28.0%
Q2
$121
$24
$97
Q2
$120
$8
$112
Q2
$297
14.9%
$53
$350
17.6%
Q2
$264
13.2%
$53
T
$317
15.9%
$0.48
0.10
550
$0.58
Q2
2022
Q3
$2,074
$610
29.4%
11
$621
29.9%
Q3
$129
$15
$114
Q3
$124
$6
$118
Q3
$357
17.2%
$32
$389
18.8%
Q3
$336
16.2%
$32
$368
17.7%
$0.61
0.06
553
$0.67
Q3
Q4
$2,101
$622
29.6%
$11
$633
30.1%
Q4
$130
$25
$105
Q4
$110
$7
$103
Q4
$288
13.7%
$43
94
$425
20.2%
Q4
$668
31.8%
$43
94
$(5)
$800
38.1%
$1.21
0.07
0.17
(0.01)
554
$1.44
Q4
Q1
$1,841
$515
28.0%
10
$525
28.5%
Q1
$111
$17
$94
Q1
$109
$4
$105
Q1
$290
15.8%
$31
5
$326
17.7%
Q1
$254
13.8%
$31
5
$-
$290
15.8%
$0.46
0.05
0.01
555
$0.52
Q1
2023
Q2
$1,845
$532
28.8%
14
$546
29.6%
Q2
$132
$24
$108
Q2
$106
$6
$100
Q2
$275
14.9%
$44
19
$338
18.3%
Q2
$237
12.8%
$44
19
$(3)
$297
16.1%
$0.43
0.08
0.03
(0.01)
556
$0.53
Q2
$546
$400
$146
Q3
$1,852
$529
28.6%
12
$541
29.2%
Q3
$143
$25
$118
Q3
$108
$7
$101
Q3
$261
14.1%
$44
17
$322
17.4%
Q3
$249
13.4%
$44
17
$(2)
$308
16.6%
$0.45
0.08
0.03
(0.01)
556
$0.55
Q3
$416
$323
$93
(1) Adjusted gross profit, adjusted selling, general and administrative, adjusted research and development expense, adjusted operating profit (loss), adjusted net income (loss), adjusted diluted earnings per share, free cash flow and any related margins are all Non-IFRS
measures. See "Financial Measures (Non-IFRS)" for a discussion of why we believe these Non-IFRS measures are useful.
(2) Includes $3.1 million of share based compensation in Q4 2022.
(3) Includes the gain on sale of our EFK business in December 2022.
(4) Reflects change to adjusted net income definition discussed in more detail elsewhere in this earnings presentation.
GlobalFoundries © 2023 All Rights Reserved
18View entire presentation