Zegna Results Presentation Deck
3Q 2022 GROUP REVENUES BY GEOGRAPHY
Positive across all regions
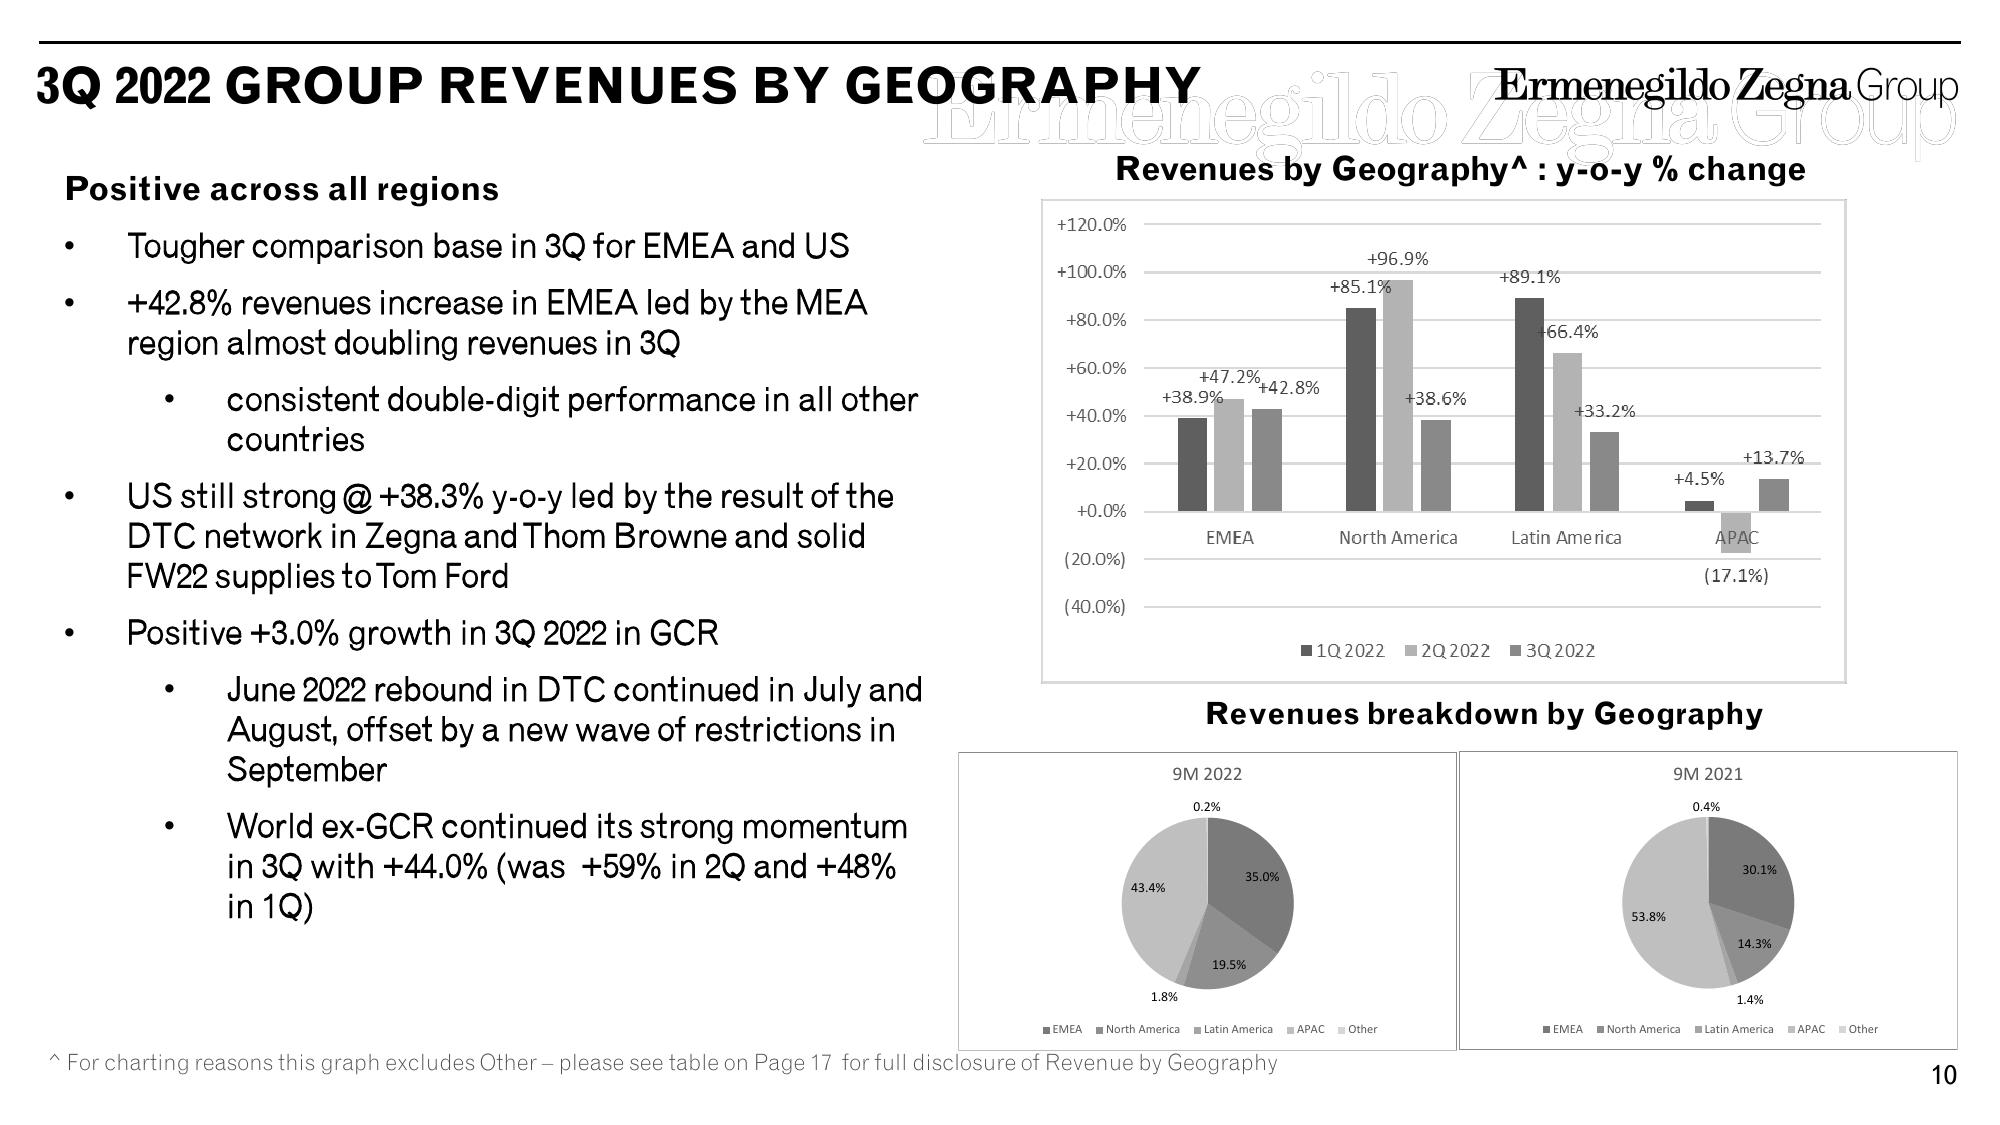
Tougher comparison base in 3Q for EMEA and US
+42.8% revenues increase in EMEA led by the MEA
region almost doubling revenues in 3Q
●
OGRAPHY
Primenegildo Ermenegildo Zegna Group
Revenues by Geography^: y-o-y % change
consistent double-digit performance in all other
countries
US still strong @ +38.3% y-o-y led by the result of the
DTC network in Zegna and Thom Browne and solid
FW22 supplies to Tom Ford
Positive +3.0% growth in 3Q 2022 in GCR
June 2022 rebound in DTC continued in July and
August, offset by a new wave of restrictions in
September
World ex-GCR continued its strong momentum
in 3Q with +44.0% (was +59% in 2Q and +48%
in 1Q)
+120.0%
+100.0%
+80.0%
+60.0%
+40.0%
+20.0%
+0.0%
(20.0%)
(40.0%)
+38.9%
43.4%
+47.2%
1.8%
EMEA
9M 2022
0.2%
+42.8%
35.0%
19.5%
+96.9%
EMEA North Americal Latin America
^ For charting reasons this graph excludes Other - please see table on Page 17 for full disclosure of Revenue by Geography
+85.1%
+38.6%
North America
+89.1%
APAC Other
66.4%
+33.2%
Revenues breakdown by Geography
Latin America
■1Q 2022 20 2022 ■ 3Q 2022
EMEA
+4.5%
53.8%
+13.7%
APAC
(17.1%)
North America
9M 2021
0.4%
30.1%
14.3%
1.4%
Latin America
APAC Other
10View entire presentation