Uber Results Presentation Deck
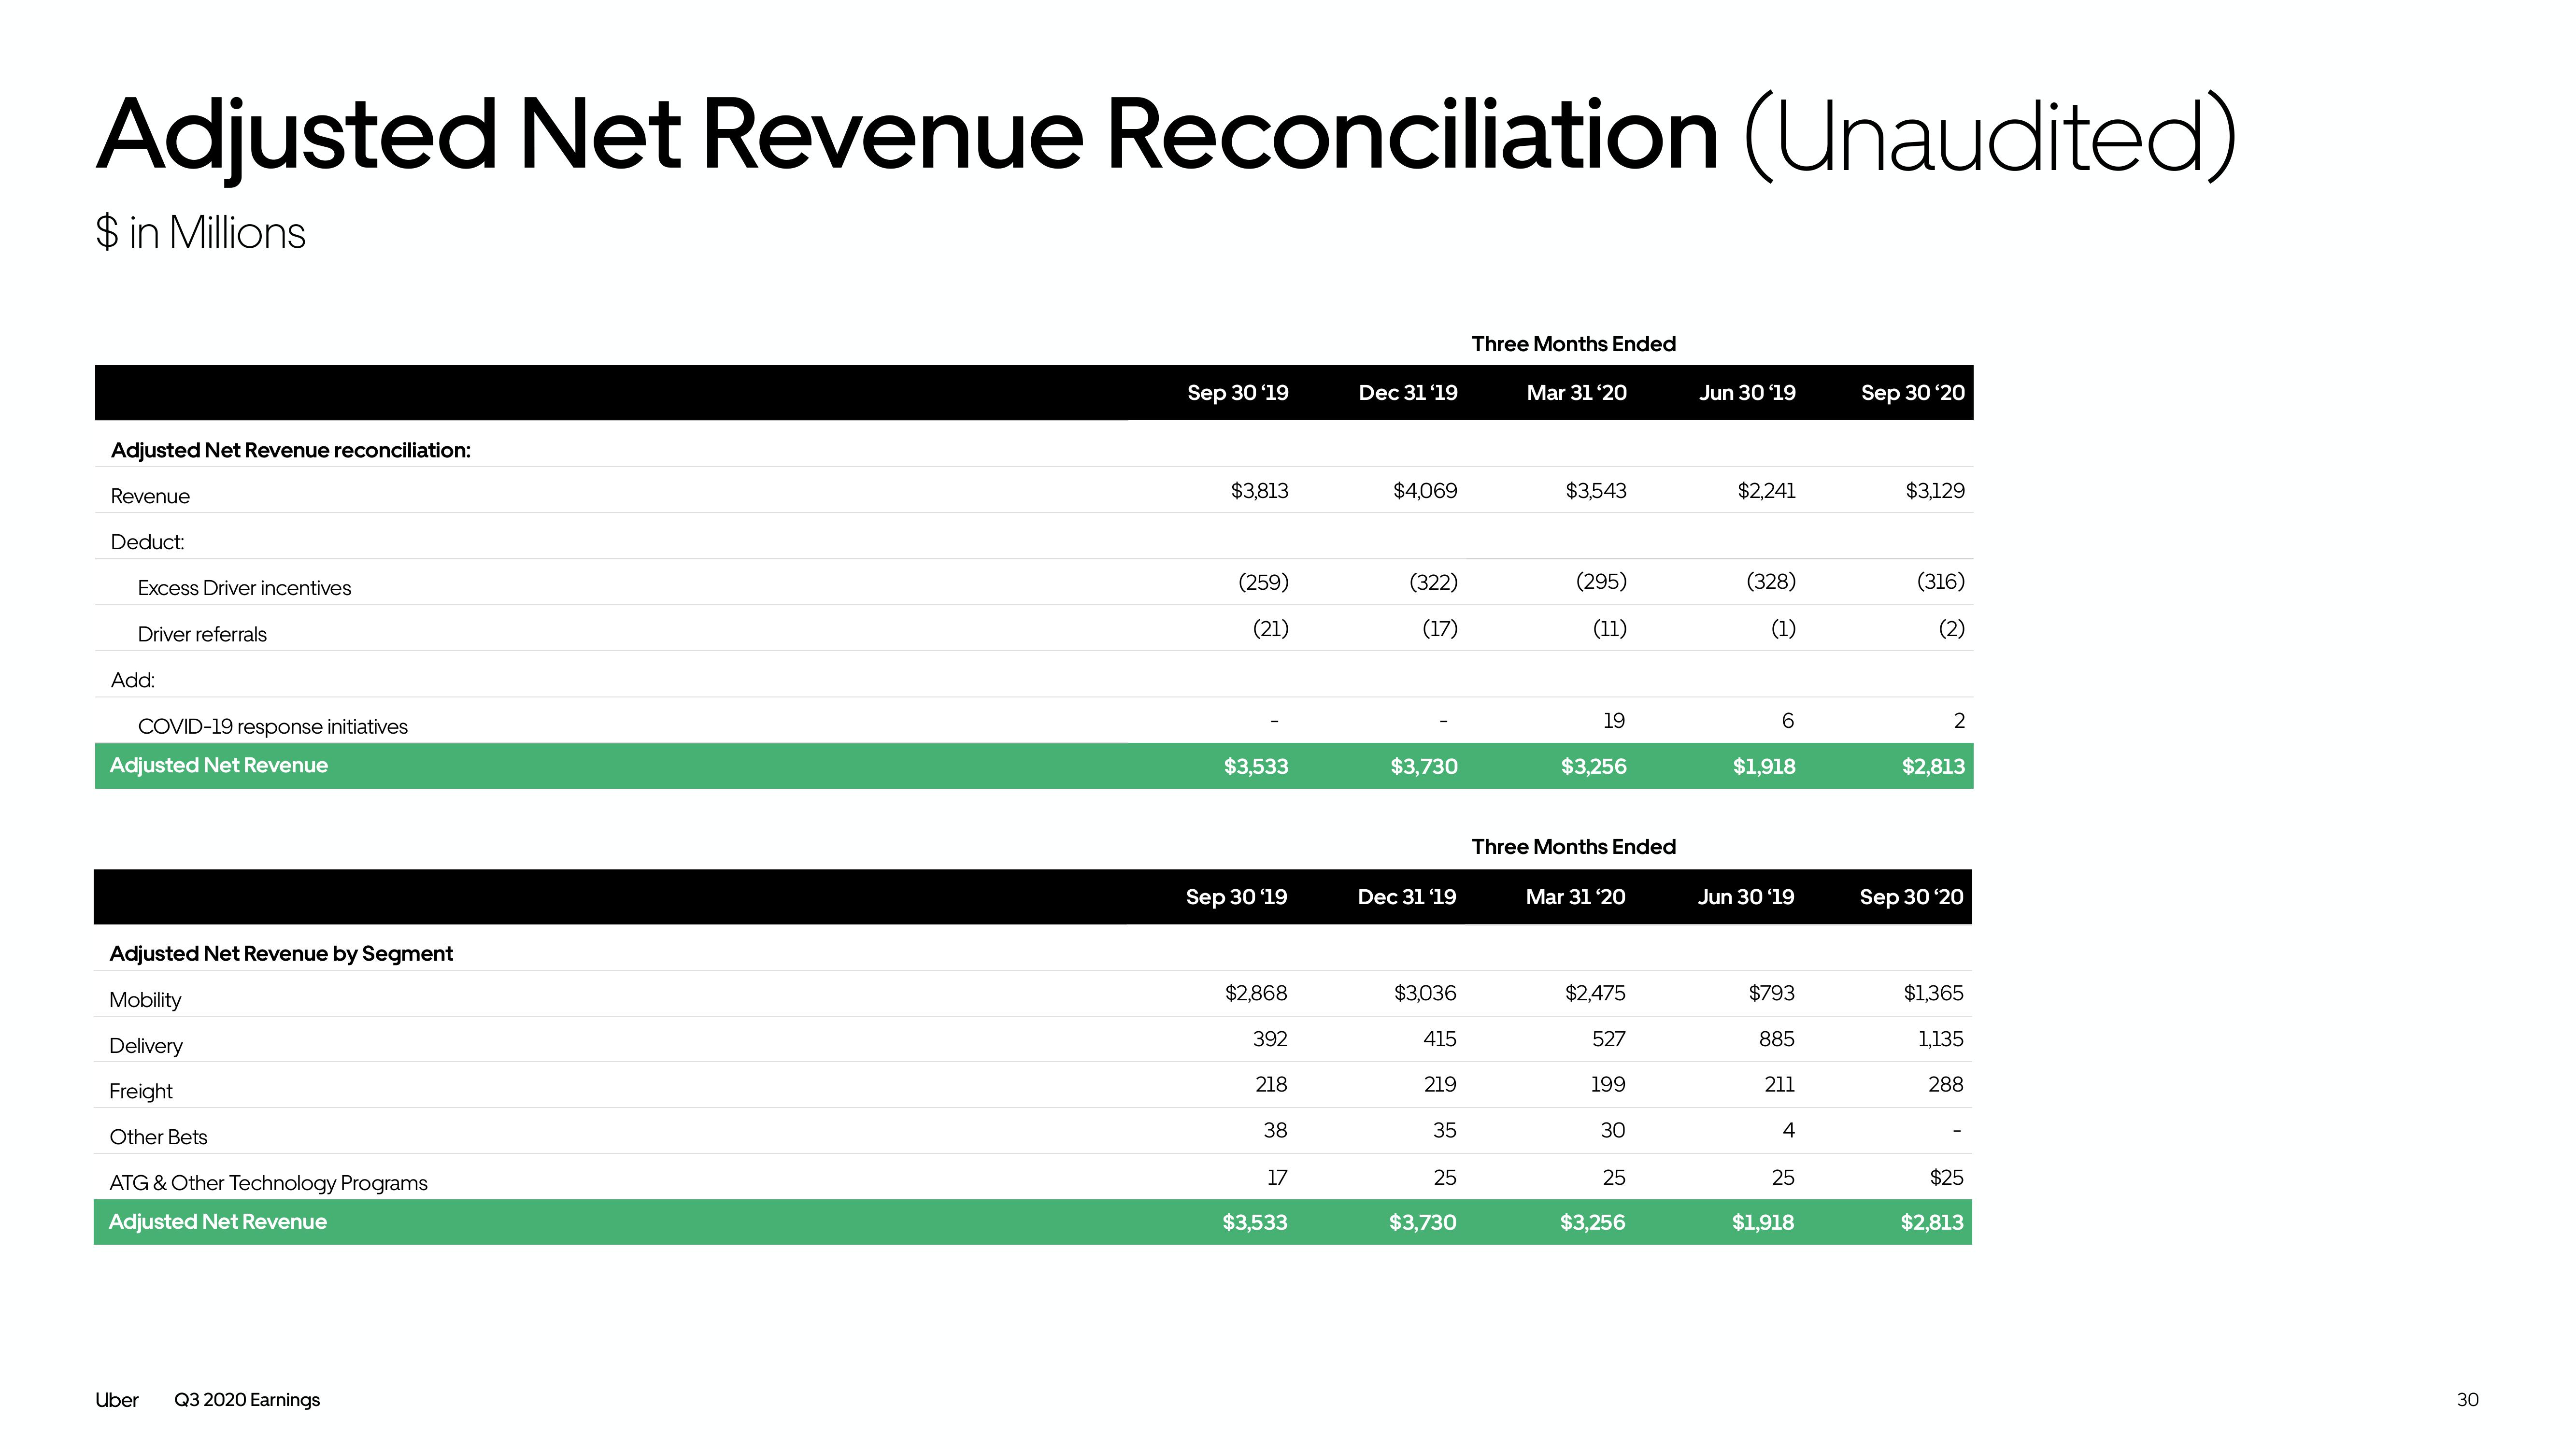
Adjusted Net Revenue Reconciliation (Unaudited)
$ in Millions
Adjusted Net Revenue reconciliation:
Revenue
Deduct:
Excess Driver incentives
Driver referrals
Add:
COVID-19 response initiatives
Adjusted Net Revenue
Adjusted Net Revenue by Segment
Mobility
Delivery
Freight
Other Bets
ATG & Other Technology Programs
Adjusted Net Revenue
Uber Q3 2020 Earnings
Sep 30'19
$3,813
(259)
(21)
$3,533
Sep 30 '19
$2,868
392
218
38
17
$3,533
Dec 31 '19
$4,069
(322)
(17)
$3,730
Dec 31 '19
$3,036
415
219
35
25
$3,730
Three Months Ended
Mar 31'20
$3,543
(295)
(11)
19
$3,256
Three Months Ended
Mar 31 '20
$2,475
527
199
30
25
$3,256
Jun 30 '19
$2,241
(328)
(1)
6
$1,918
Jun 30 '19
$793
885
211
4
25
$1,918
Sep 30'20
$3,129
(316)
(2)
2
$2,813
Sep 30 '20
$1,365
1,135
288
$25
$2,813
30View entire presentation