Hexagon Purus Results Presentation Deck
35
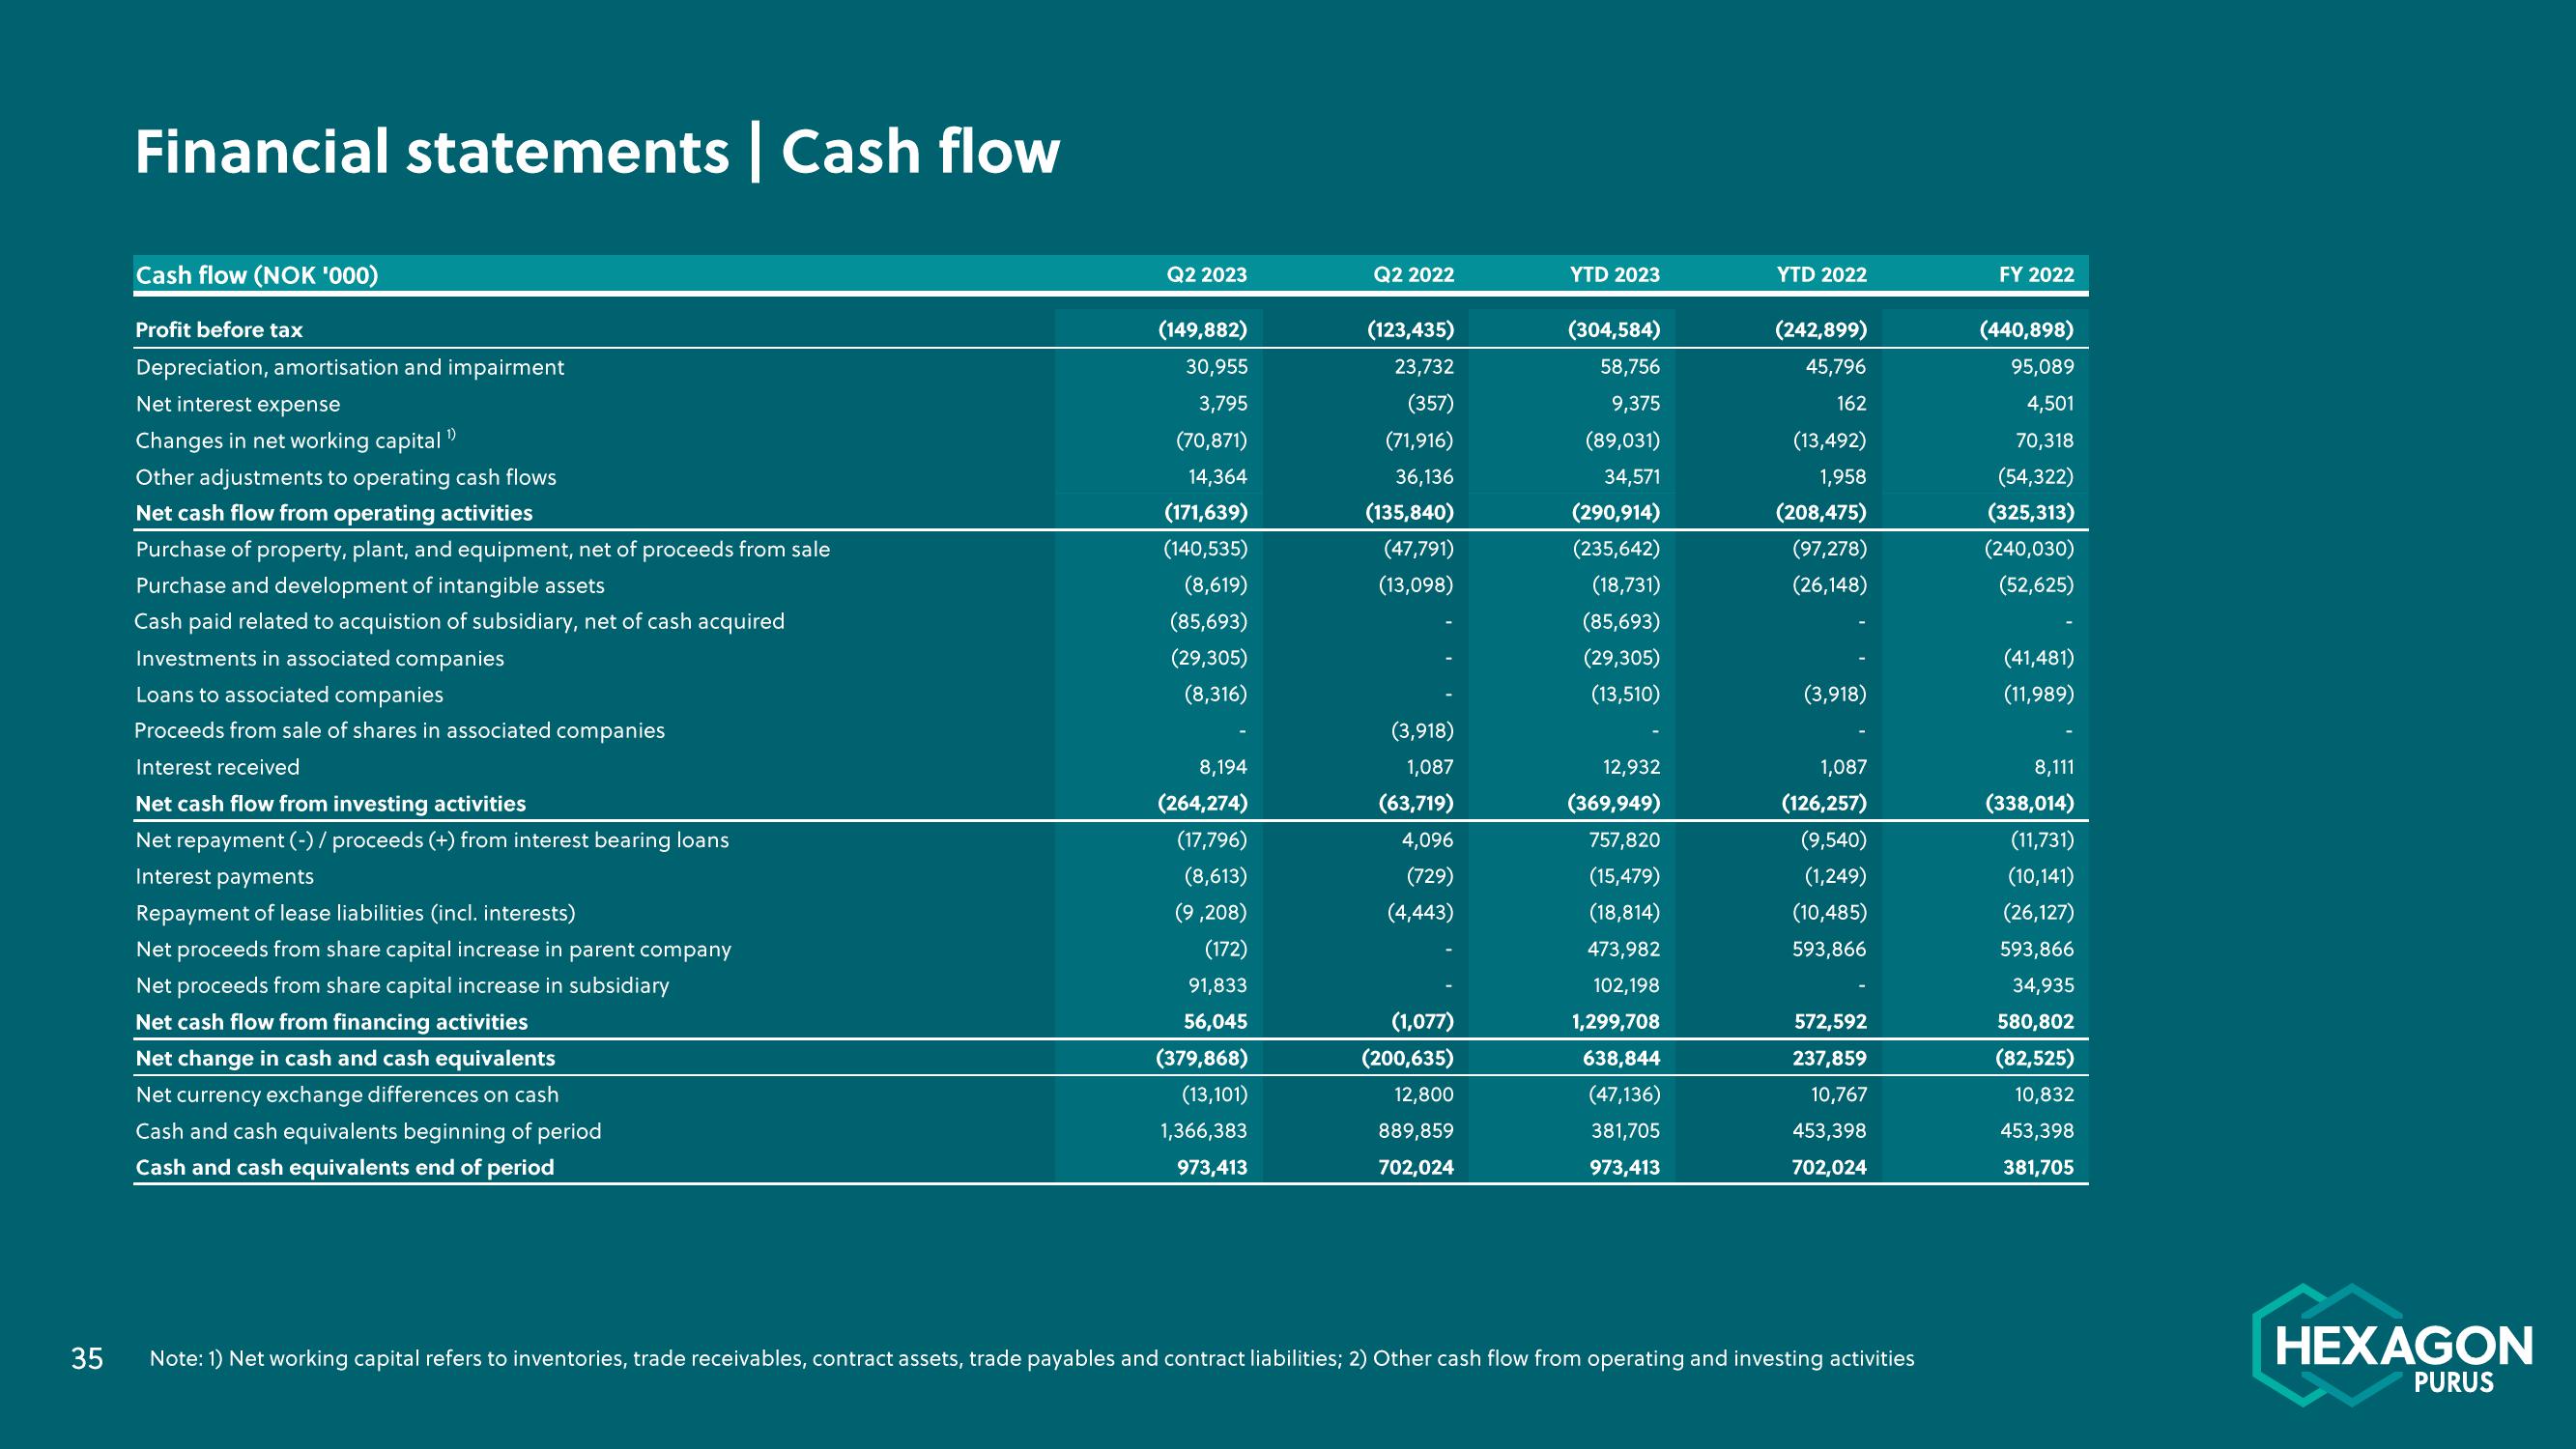
Financial statements | Cash flow
Cash flow (NOK '000)
Profit before tax
Depreciation, amortisation and impairment
Net interest expense
Changes in net working capital ¹
1)
Other adjustments to operating cash flows
Net cash flow from operating activities
Purchase of property, plant, and equipment, net of proceeds from sale
Purchase and development of intangible assets
Cash paid related to acquistion of subsidiary, net of cash acquired
Investments in associated companies
Loans to associated companies
Proceeds from sale of shares in associated companies
Interest received
Net cash flow from investing activities
Net repayment (-) / proceeds (+) from interest bearing loans
Interest payments
Repayment of lease liabilities (incl. interests)
Net proceeds from share capital increase in parent company
Net proceeds from share capital increase in subsidiary
Net cash flow from financing activities
Net change in cash and cash equivalents
Net currency exchange differences on cash
Cash and cash equivalents beginning of period
Cash and cash equivalents end of period
Q2 2023
(149,882)
30,955
3,795
(70,871)
14,364
(171,639)
(140,535)
(8,619)
(85,693)
(29,305)
(8,316)
8,194
(264,274)
(17,796)
(8,613)
(9,208)
(172)
91,833
56,045
(379,868)
(13,101)
1,366,383
973,413
Q2 2022
(123,435)
23,732
(357)
(71,916)
36,136
(135,840)
(47,791)
(13,098)
(3,918)
1,087
(63,719)
4,096
(729)
(4,443)
(1,077)
(200,635)
12,800
889,859
702,024
YTD 2023
(304,584)
58,756
9,375
(89,031)
34,571
(290,914)
(235,642)
(18,731)
(85,693)
(29,305)
(13,510)
12,932
(369,949)
757,820
(15,479)
(18,814)
473,982
102,198
1,299,708
638,844
(47,136)
381,705
973,413
YTD 2022
(242,899)
45,796
162
(13,492)
1,958
(208,475)
(97,278)
(26,148)
(3,918)
1,087
(126,257)
(9,540)
(1,249)
(10,485)
593,866
572,592
237,859
10,767
453,398
702,024
Note: 1) Net working capital refers to inventories, trade receivables, contract assets, trade payables and contract liabilities; 2) Other cash flow from operating and investing activities
FY 2022
(440,898)
95,089
4,501
70,318
(54,322)
(325,313)
(240,030)
(52,625)
(41,481)
(11,989)
8,111
(338,014)
(11,731)
(10,141)
(26,127)
593,866
34,935
580,802
(82,525)
10,832
453,398
381,705
HEXAGON
PURUSView entire presentation