Sonos Results Presentation Deck
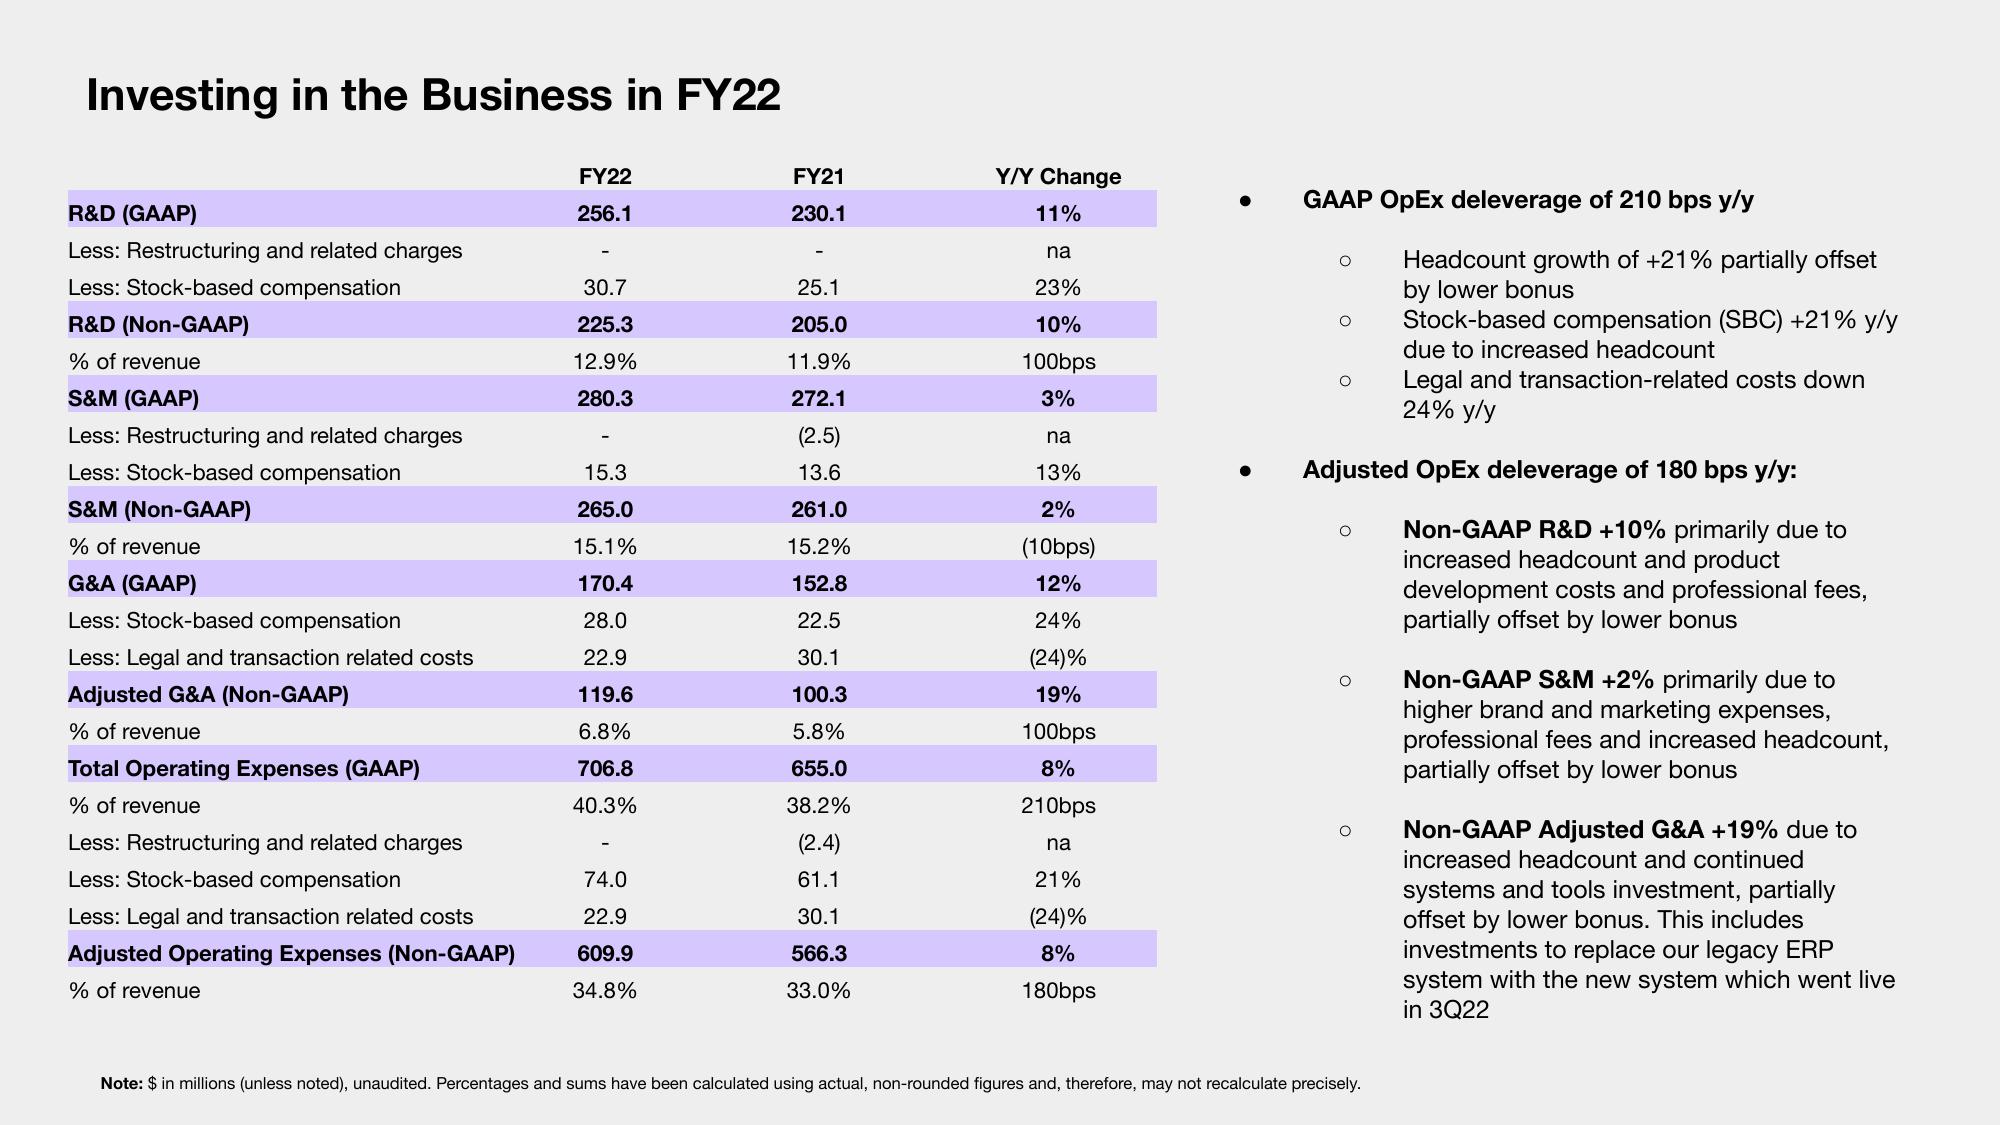
Investing in the Business in FY22
R&D (GAAP)
Less: Restructuring and related charges
Less: Stock-based compensation
R&D (Non-GAAP)
% of revenue
S&M (GAAP)
Less: Restructuring and related charges
Less: Stock-based compensation
S&M (Non-GAAP)
% of revenue
G&A (GAAP)
Less: Stock-based compensation
Less: Legal and transaction related costs
Adjusted G&A (Non-GAAP)
% of revenue
Total Operating Expenses (GAAP)
% of revenue
Less: Restructuring and related charges
Less: Stock-based compensation
Less: Legal and transaction related costs
Adjusted Operating Expenses (Non-GAAP)
% of revenue
FY22
256.1
30.7
225.3
12.9%
280.3
15.3
265.0
15.1%
170.4
28.0
22.9
119.6
6.8%
706.8
40.3%
74.0
22.9
609.9
34.8%
FY21
230.1
25.1
205.0
11.9%
272.1
(2.5)
13.6
261.0
15.2%
152.8
22.5
30.1
100.3
5.8%
655.0
38.2%
(2.4)
61.1
30.1
566.3
33.0%
Y/Y Change
11%
na
23%
10%
100bps
3%
na
13%
2%
(10bps)
12%
24%
(24)%
19%
100bps
8%
210bps
na
21%
(24)%
8%
180bps
GAAP OpEx deleverage of 210 bps y/y
O
O
O
O
Headcount growth of +21% partially offset
by lower bonus
Stock-based compensation (SBC) +21% y/y
due to increased headcount
Adjusted OpEx deleverage of 180 bps y/y:
Non-GAAP R&D +10% primarily due to
increased headcount and product
development costs and professional fees,
partially offset by lower bonus
Legal and transaction-related costs down
24% y/y
Note: $ in millions (unless noted), unaudited. Percentages and sums have been calculated using actual, non-rounded figures and, therefore, may not recalculate precisely.
O Non-GAAP S&M +2% primarily due to
higher brand and marketing expenses,
professional fees and increased headcount,
partially offset by lower bonus
Non-GAAP Adjusted G&A +19% due to
increased headcount and continued
systems and tools investment, partially
offset by lower bonus. This includes
investments to replace our legacy ERP
system with the new system which went live
in 3Q22View entire presentation