Trian Partners Activist Presentation Deck
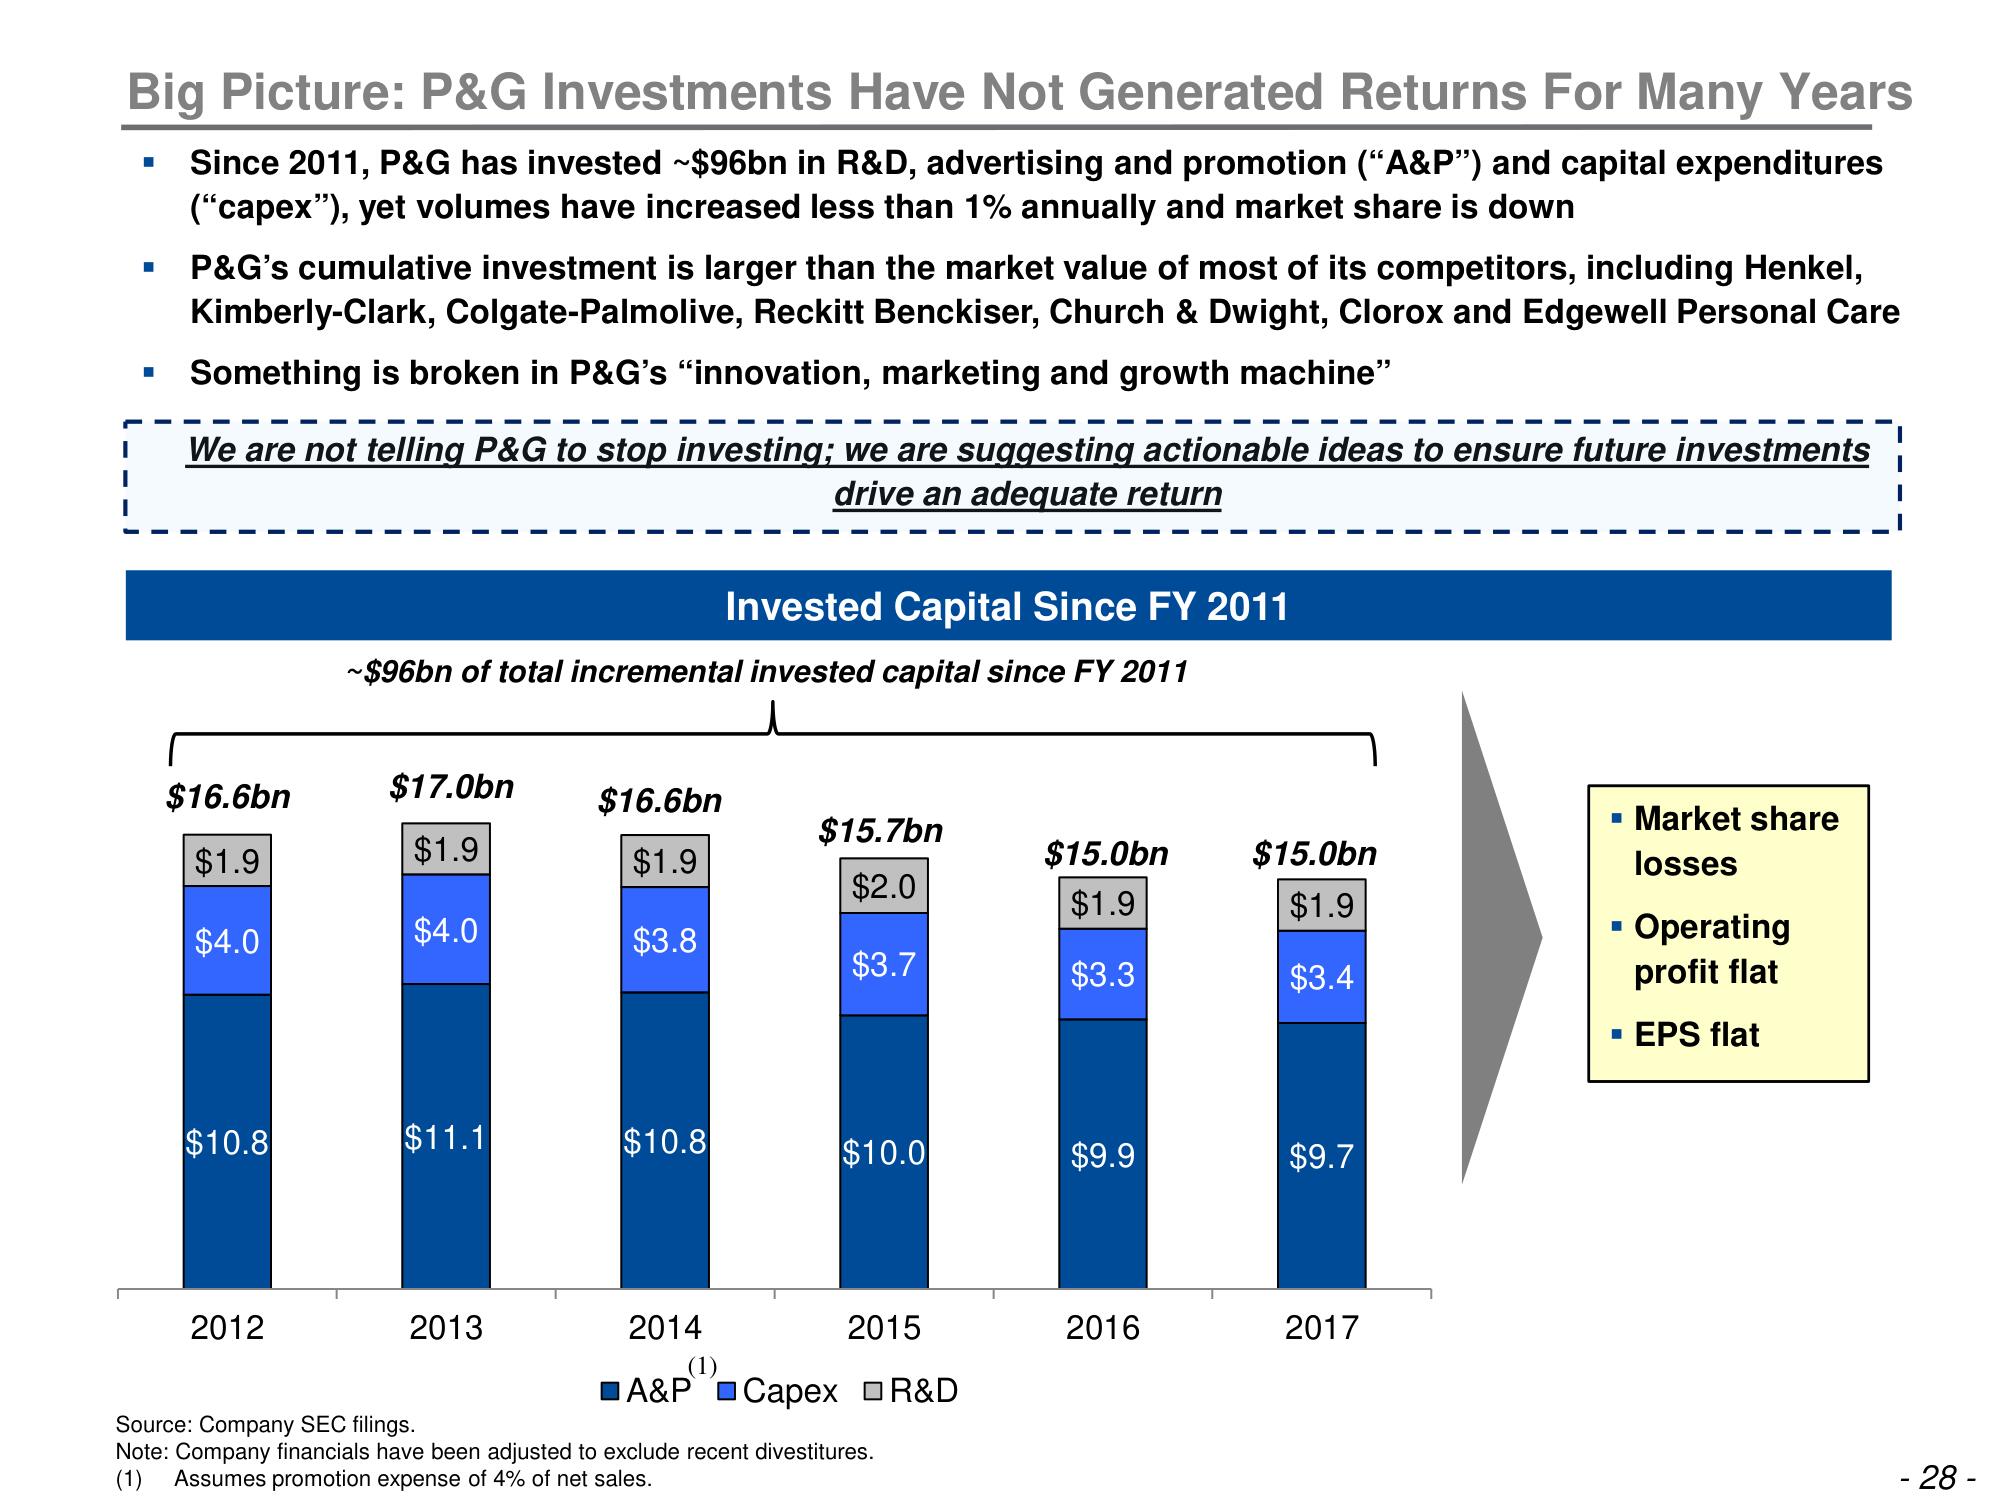
Big Picture: P&G Investments Have Not Generated Returns For Many Years
Since 2011, P&G has invested ~$96bn in R&D, advertising and promotion (“A&P”) and capital expenditures
("capex"), yet volumes have increased less than 1% annually and market share is down
I
■
■
P&G's cumulative investment is larger than the market value of most of its competitors, including Henkel,
Kimberly-Clark, Colgate-Palmolive, Reckitt Benckiser, Church & Dwight, Clorox and Edgewell Personal Care
Something is broken in P&G's "innovation, marketing and growth machine"
We are not telling P&G to stop investing; we are suggesting actionable ideas to ensure future investments
drive an adequate return
$16.6bn
$1.9
$4.0
$10.8
2012
~$96bn of total incremental invested capital since FY 2011
$17.0bn
$1.9
$4.0
$11.1
2013
$16.6bn
$1.9
$3.8
$10.8
Invested Capital Since FY 2011
2014
$15.7bn
$2.0
$3.7
$10.0
2015
(1)
A&P Capex □R&D
Source: Company SEC filings.
Note: Company financials have been adjusted to exclude recent divestitures.
(1) Assumes promotion expense of 4% of net sales.
$15.0bn
$1.9
$3.3
$9.9
2016
$15.0bn
$1.9
$3.4
$9.7
2017
▪ Market share
losses
▪ Operating
profit flat
EPS flat
■
I
- 28-View entire presentation