Netstreit Investor Presentation Deck
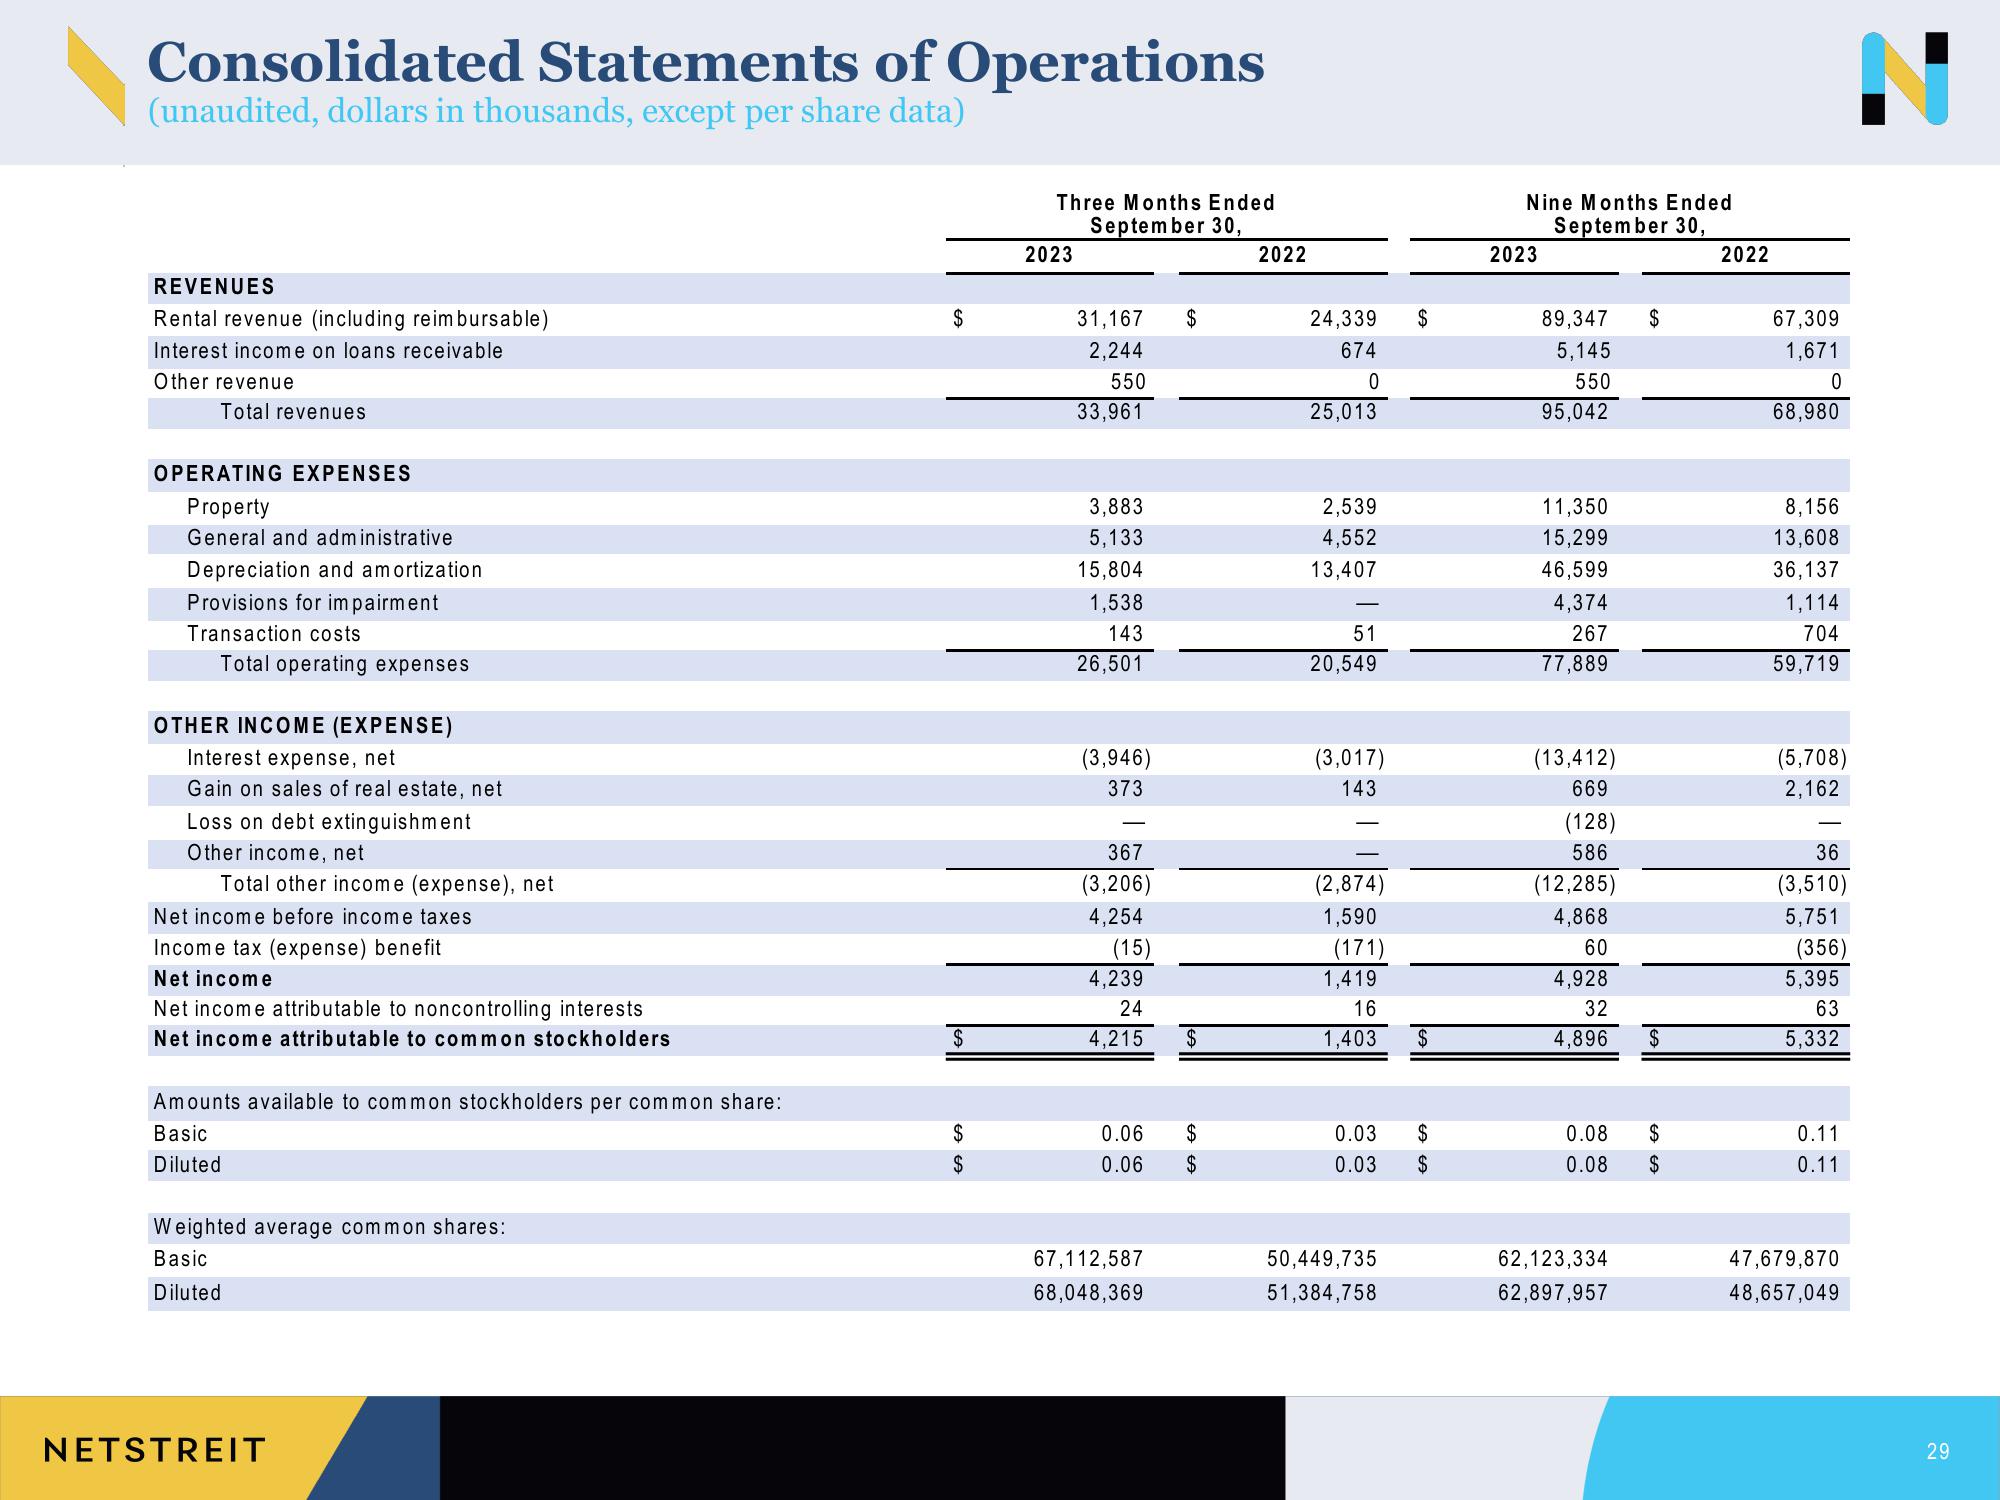
Consolidated Statements of Operations
(unaudited, dollars in thousands, except per share data)
REVENUES
Rental revenue (including reimbursable)
Interest income on loans receivable
Other revenue
Total revenues
OPERATING EXPENSES
Property
General and administrative
Depreciation and amortization
Provisions for impairment
Transaction costs
Total operating expenses
OTHER INCOME (EXPENSE)
Interest expense, net
Gain on sales of real estate, net
Loss on debt extinguishment
Other income, net
Total other income (expense), net
Net income before income taxes
Income tax (expense) benefit
Net income
Net income attributable to non controlling interests
Net income attributable to common stockholders
Amounts available to common stockholders per common share:
Basic
Diluted
Weighted average common shares:
Basic
Diluted
NETSTREIT
$
$
$
$
Three Months Ended
September 30,
2023
31,167 $
2,244
550
33,961
3,883
5,133
15,804
1,538
143
26,501
(3,946)
373
367
(3,206)
4,254
(15)
4,239
24
4,215
0.06
0.06
67,112,587
68,048,369
$
$
$
2022
24,339
674
0
25,013
2,539
4,552
13,407
51
20,549
(3,017)
143
(2,874)
1,590
(171)
1,419
16
1,403
$
50,449,735
51,384,758
$
$
0.03
0.03 $
Nine Months Ended
September 30,
2023
89,347
5,145
550
95,042
11,350
15,299
46,599
4,374
267
77,889
(13,412)
669
(128)
586
(12,285)
4,868
60
4,928
32
4,896
0.08
0.08
62,123,334
62,897,957
$
$
$
$
2022
67,309
1,671
0
68,980
8,156
13,608
36,137
1,114
704
59,719
(5,708)
2,162
36
(3,510)
5,751
(356)
5,395
63
5,332
0.11
0.11
47,679,870
48,657,049
29View entire presentation