NextNav SPAC Presentation Deck
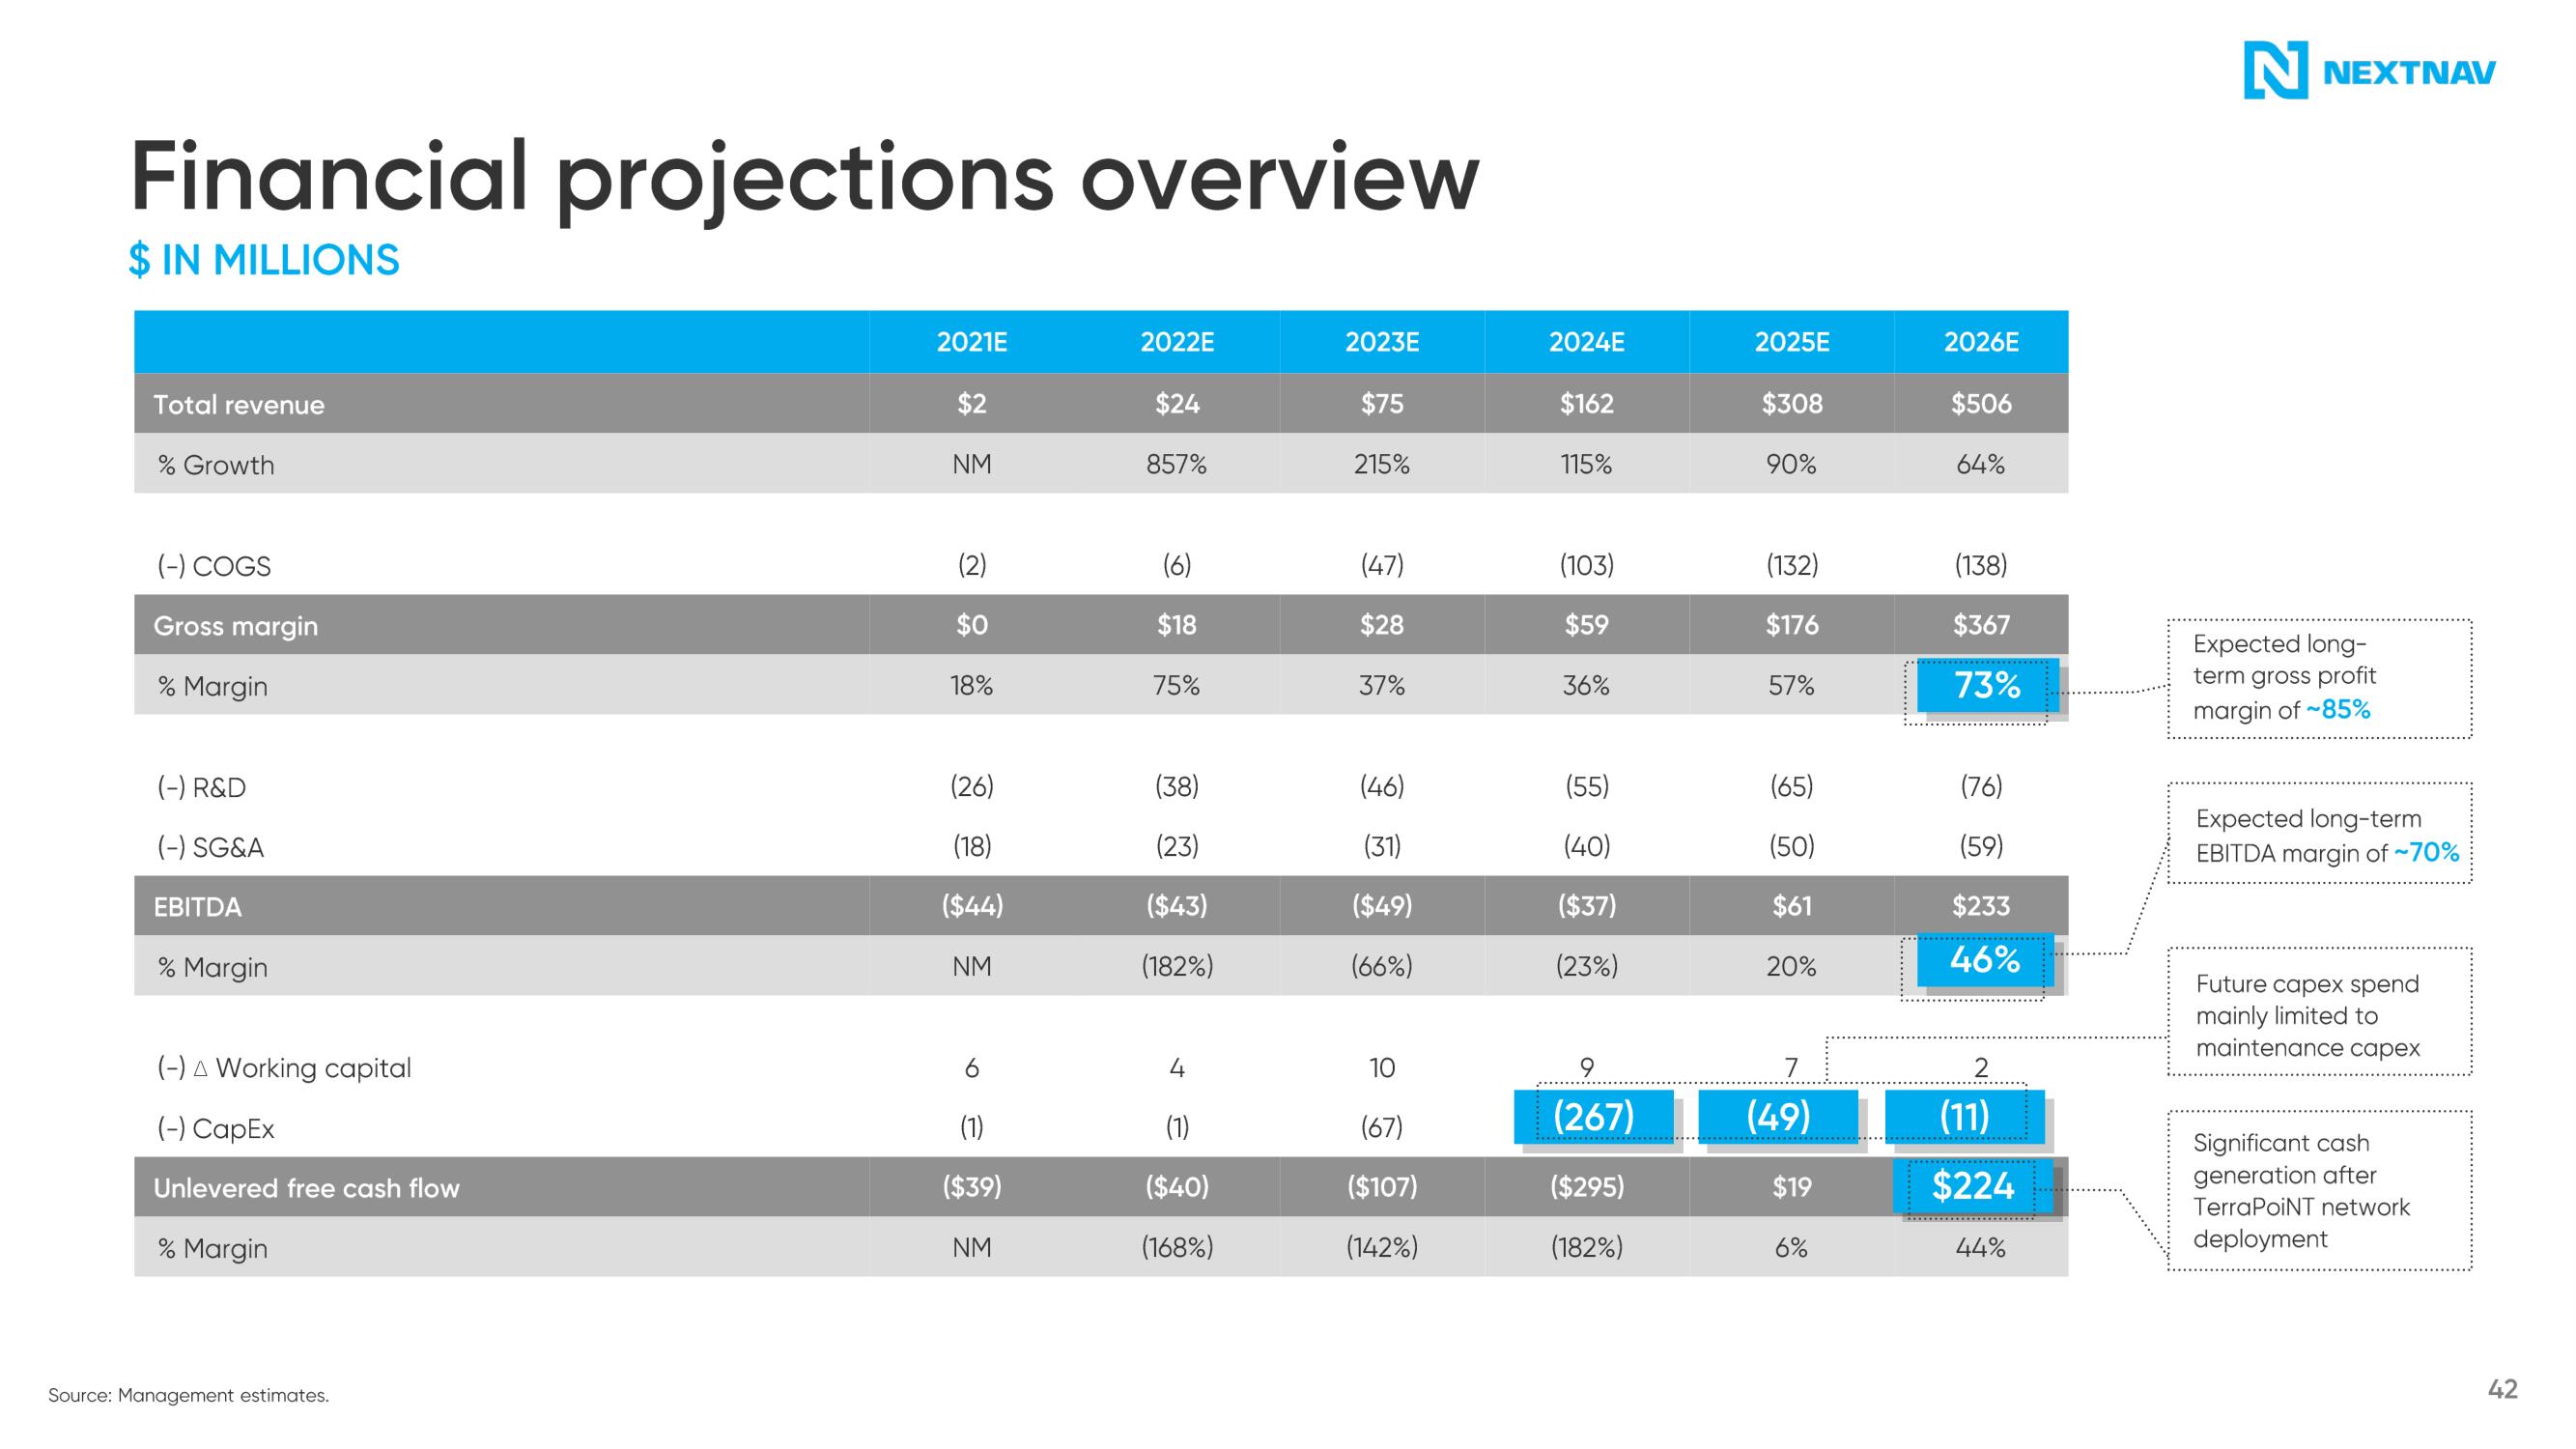
Financial projections overview
$ IN MILLIONS
Total revenue
% Growth
(-) COGS
Gross margin
% Margin
(-) R&D
(-) SG&A
EBITDA
% Margin
(-) A Working capital
(-) CapEx
Unlevered free cash flow
% Margin
Source: Management estimates.
2021E
$2
NM
(2)
$0
18%
(26)
(18)
($44)
NM
(1)
($39)
NM
2022E
$24
857%
(6)
$18
75%
(38)
(23)
($43)
(182%)
4
(1)
($40)
(168%)
2023E
$75
215%
(47)
$28
37%
(46)
(31)
($49)
(66%)
10
(67)
($107)
(142%)
2024E
$162
115%
(103)
$59
36%
(55)
(40)
($37)
(23%)
(267)
**************
($295)
(182%)
2025E
$308
90%
(132)
$176
57%
(65)
(50)
$61
20%
7
(49)
$19
6%
2026E
$506
64%
(138)
$367
73%
(76)
(59)
$233
46%
2
(11)
$224
44%
N NEXTNAV
Expected long-
term gross profit
margin of ~85%
Expected long-term
EBITDA margin of ~70%
Future capex spend
mainly limited to
maintenance capex
Significant cash
generation after
TerraPoiNT network
deployment
42View entire presentation