Rush Street SPAC Presentation Deck
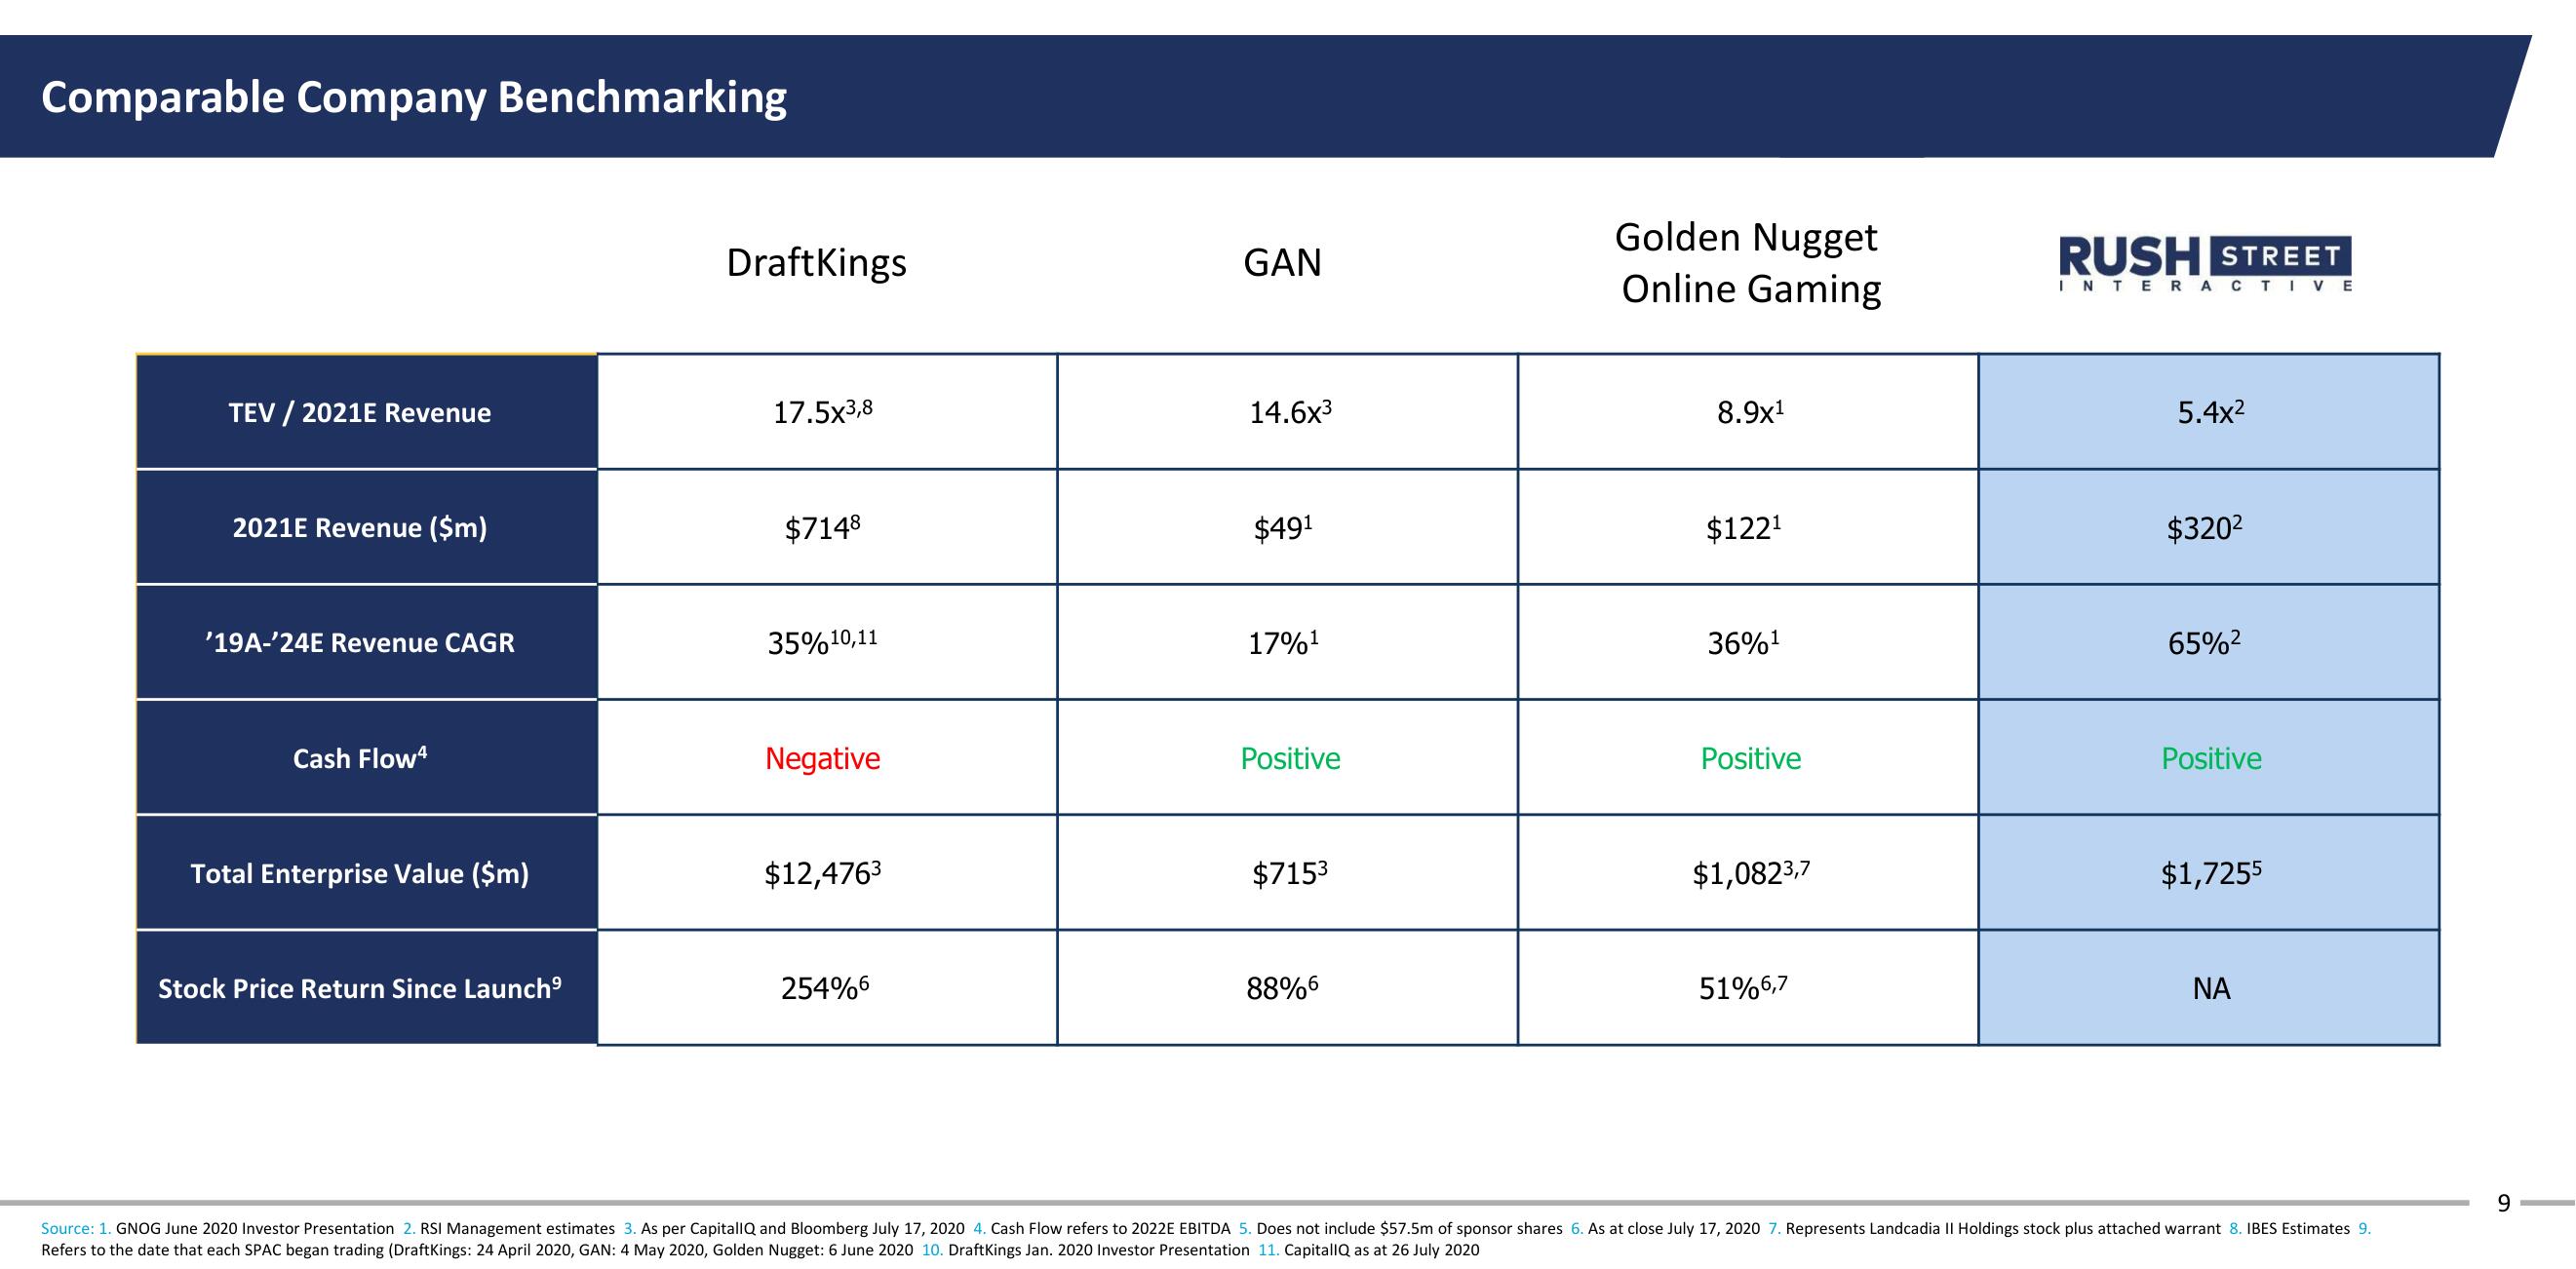
Comparable Company Benchmarking
TEV / 2021E Revenue
2021E Revenue ($m)
'19A-'24E Revenue CAGR
Cash Flow4
Total Enterprise Value ($m)
Stock Price Return Since Launch⁹
DraftKings
17.5x3,8
$7148
35% 10,11
Negative
$12,4763
254%6
GAN
14.6x³
$491
17%¹
Positive
$7153
88%6
Golden Nugget
Online Gaming
8.9x¹
$122¹
36%¹
Positive
$1,0823,7
51%6,7
RUSH STREET
INTERACTIVE
5.4x²
$320²
65%²
Positive
$1,7255
ΝΑ
Source: 1. GNOG June 2020 Investor Presentation 2. RSI Management estimates 3. As per CapitallQ and Bloomberg July 17, 2020 4. Cash Flow refers to 2022E EBITDA 5. Does not include $57.5m of sponsor shares 6. As at close July 17, 2020 7. Represents Landcadia II Holdings stock plus attached warrant 8. IBES Estimates 9.
Refers to the date that each SPAC began trading (DraftKings: 24 April 2020, GAN: 4 May 2020, Golden Nugget: 6 June 2020 10. DraftKings Jan. 2020 Investor Presentation 11. CapitallQ as at 26 July 2020
9View entire presentation