Grubhub Investor Presentation Deck
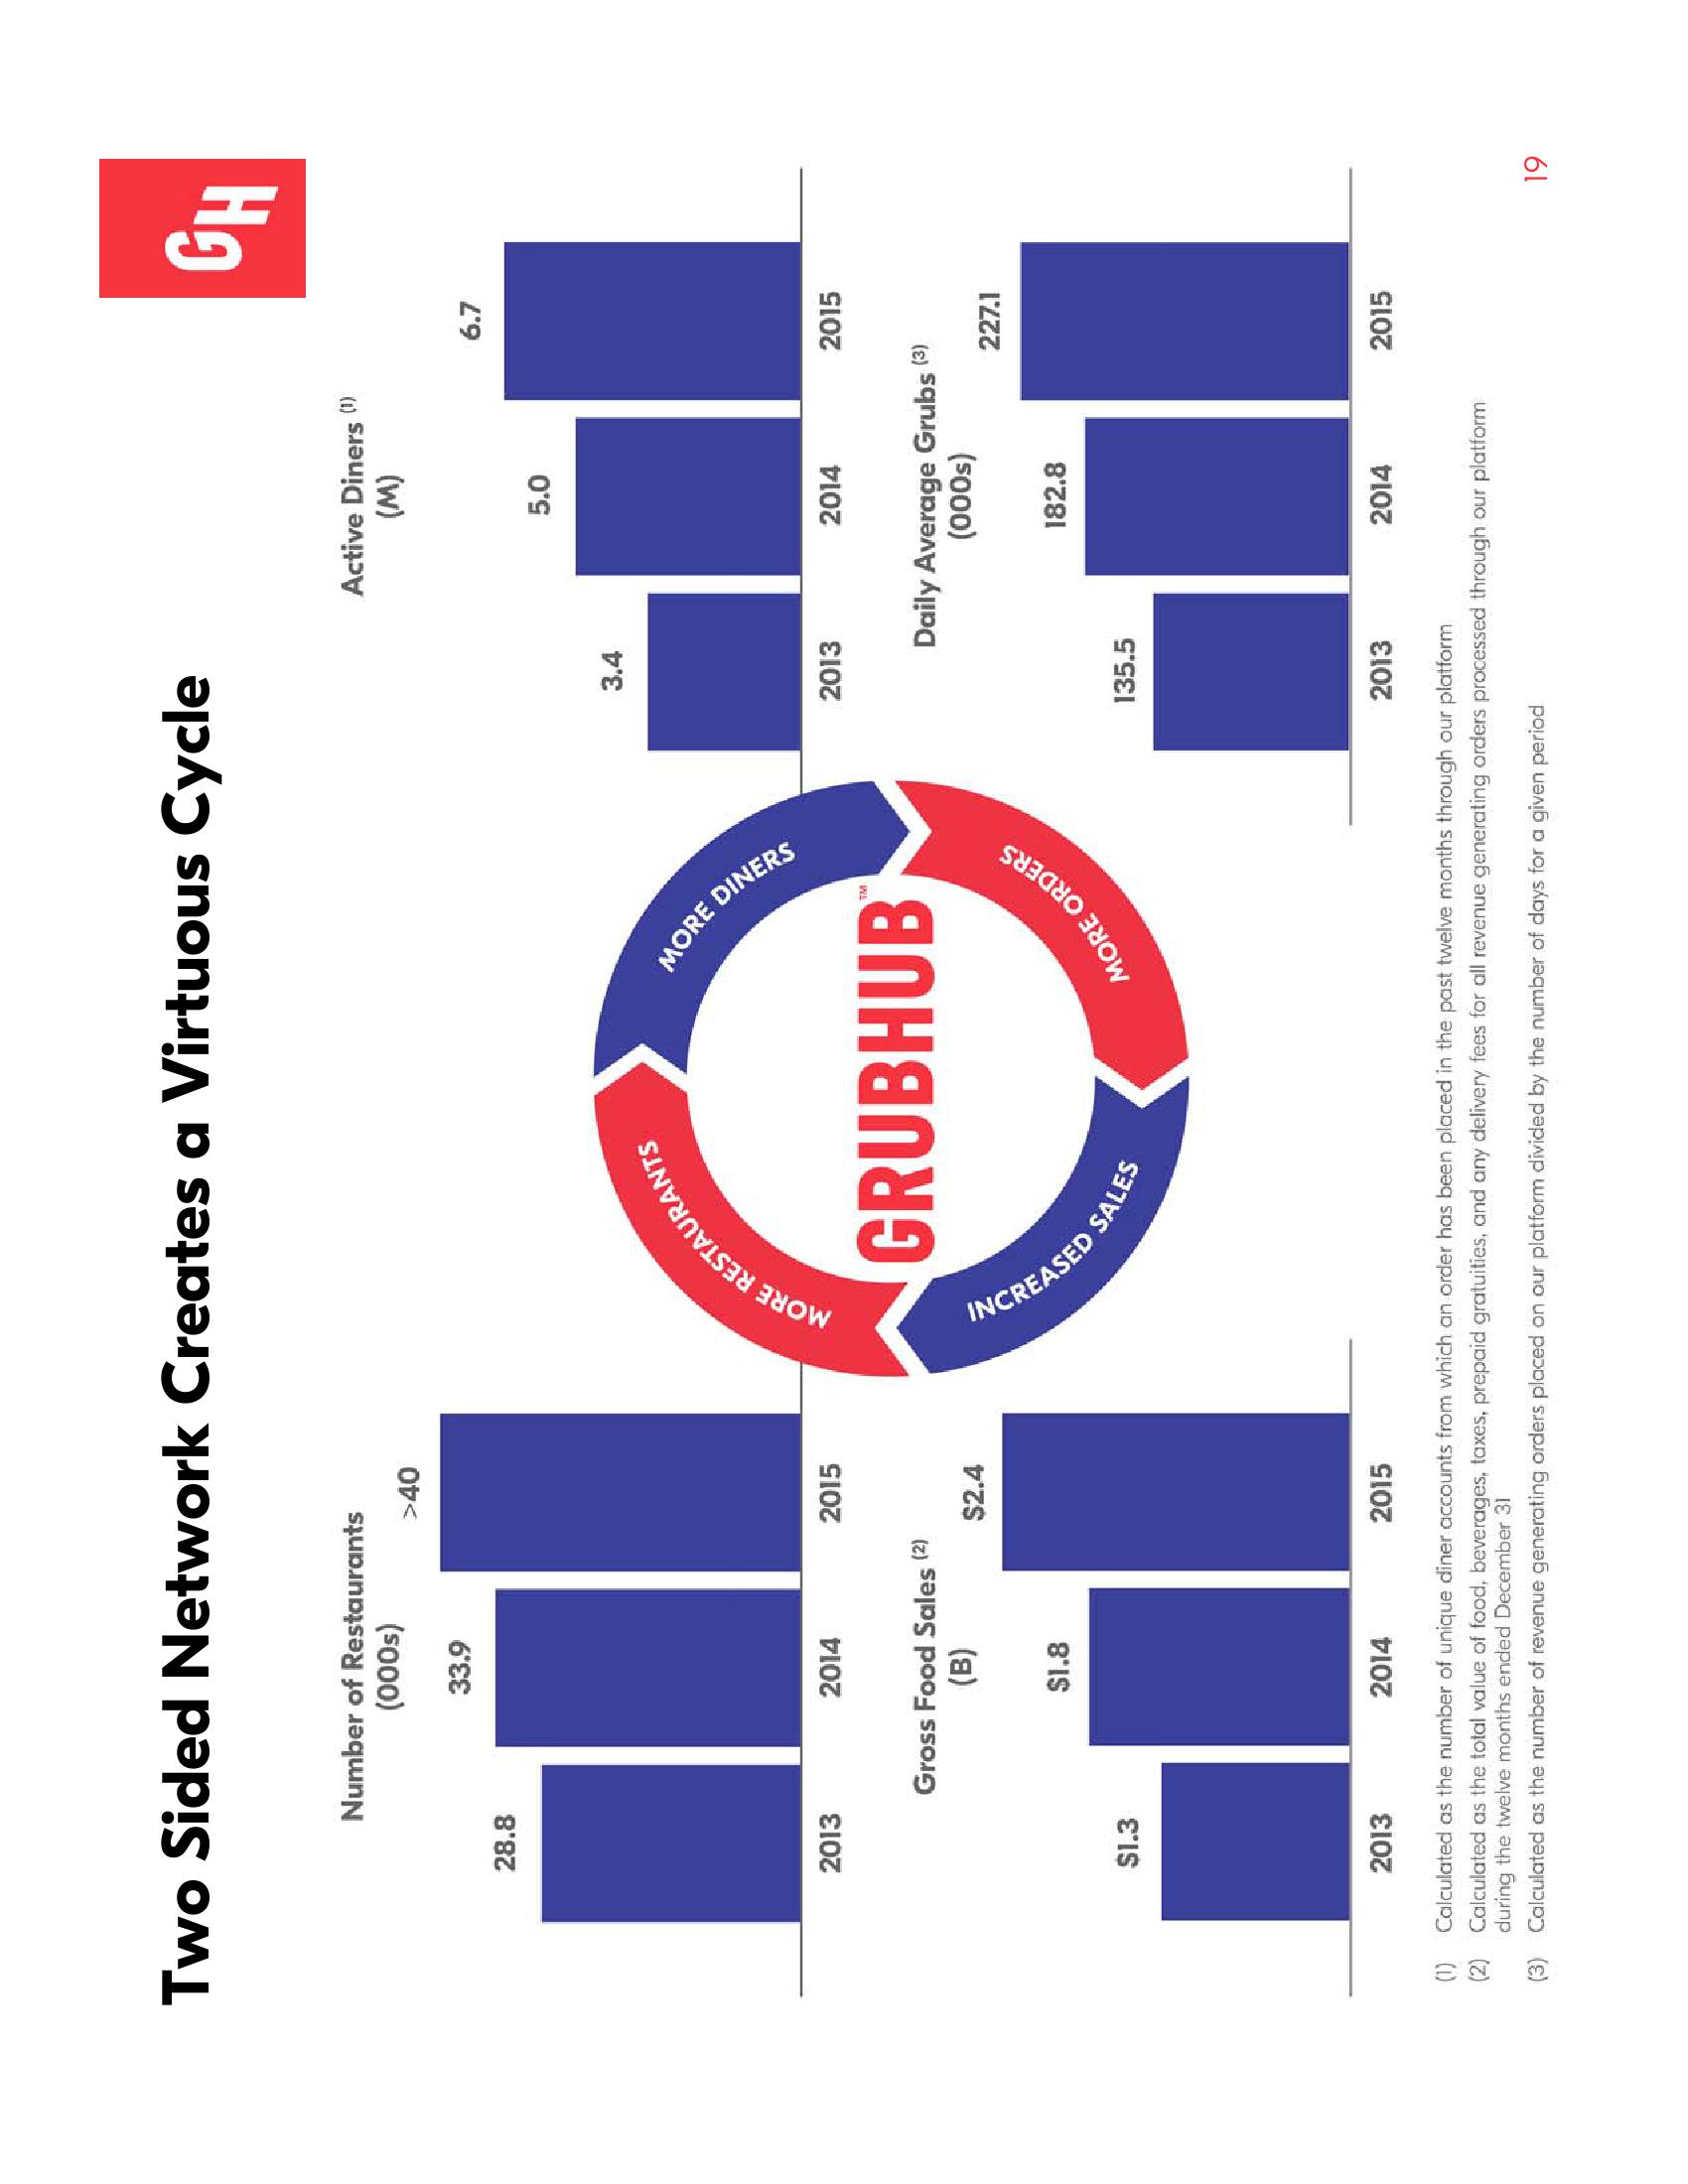
Two Sided Network Creates a Virtuous Cycle
Number of Restaurants
(000s)
28.8
2013
$1.3
2013
33.9
2014
Gross Food Sales (2)
(B)
$1.8
2014
>40
2015
$2.4
2015
MORE RESTAURANTS
MORE DINERS
GRUBHUB
NCREASED SA
MORE ORDERS
3.4
2013
135.5
Active Diners (¹)
(M)
2013
5.0
2014
Daily Average Grubs (3)
(000s)
182.8
2014
(1)
Calculated as the number of unique diner accounts from which an order has been placed in the past twelve months through our platform
(2) Calculated as the total value of food, beverages, taxes, prepaid gratuities, and any delivery fees for all revenue generating orders processed through our platform
during the twelve months ended December 31
(3)
Calculated as the number of revenue generating orders placed on our platform divided by the number of days for a given period
6.7
2015
227.1
2015
GH
19View entire presentation