UBS Results Presentation Deck
Investment Bank
Total revenues,
m
2,908
929
Profit before tax,
m
1Q22
(19%)
UBS
2,349
(49%)
477
1Q23
USDm, except where indicated
Total revenues
Global Banking
Advisory
Capital Markets
Global Markets
Execution Services
Derivatives & Solutions
Financing
Credit loss expense / (release)
Operating expenses
Profit before tax
Cost / income ratio
Return on attributed equity
1Q23 4Q22 1Q22 QoQ
2,349
383
171
212
1,967
422
1,007
537
7
1,866
477
79%
15%
172
331 550
1,682 2,908 +40% (19%)
+16% (30%)
216 (1%) (21%)
+33% (37%)
+46% (17%)
371 496 +14% (15%)
541 1,418 +86% (29%)
438
444 +23% +21%
1,351 2,358
159
8
334
93%
4
YoY
1,563 1,976
+19%
(6%)
112 929 +327% (49%)
68% (13pp) +11pp
4% 28%
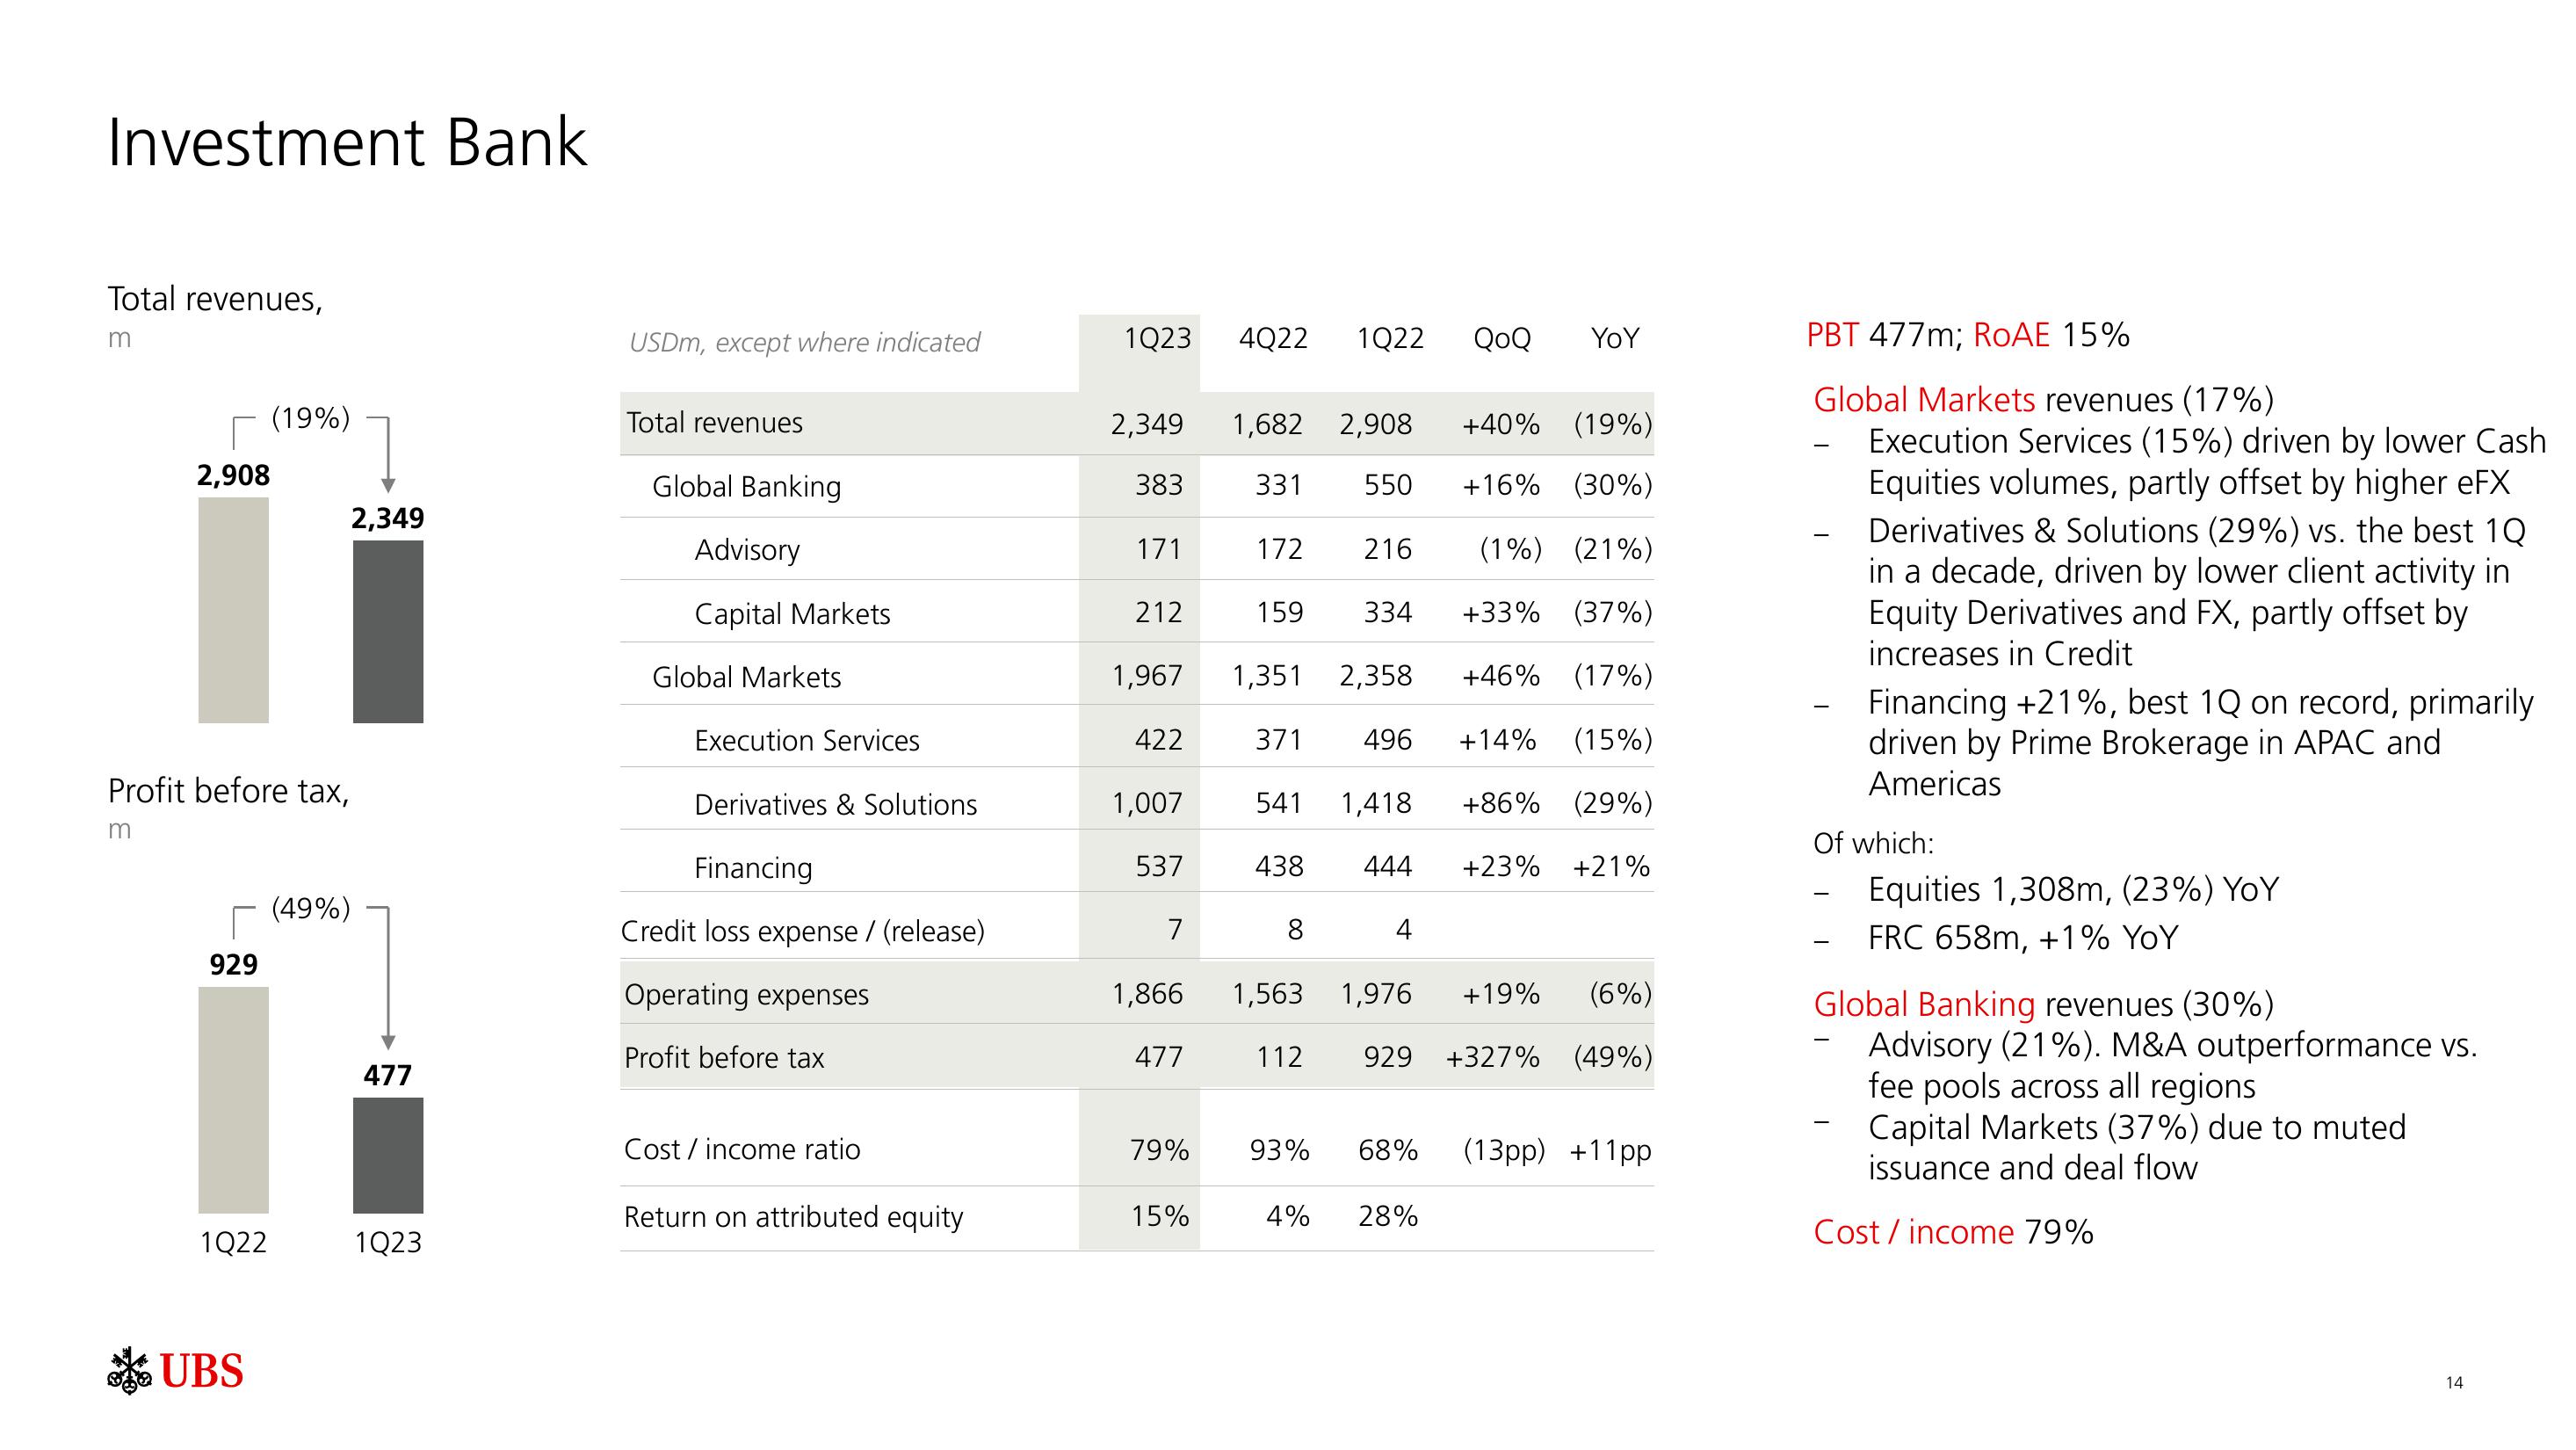
PBT 477m; ROAE 15%
Global Markets revenues (17%)
Execution Services (15%) driven by lower Cash
Equities volumes, partly offset by higher eFX
Derivatives & Solutions (29%) vs. the best 1Q
in a decade, driven by lower client activity in
Equity Derivatives and FX, partly offset by
increases in Credit
Financing +21%, best 1Q on record, primarily
driven by Prime Brokerage in APAC and
Americas
Of which:
Equities 1,308m, (23%) YoY
FRC 658m, +1% YoY
Global Banking revenues (30%)
Advisory (21%). M&A outperformance vs.
fee pools across all regions
Capital Markets (37%) due to muted
issuance and deal flow
Cost/income 79%
14View entire presentation