Sotheby's Investor Briefing
WELL POSITIONED FOR CYCLICAL GROWTH OPPORTUNITY
.
#
.
#
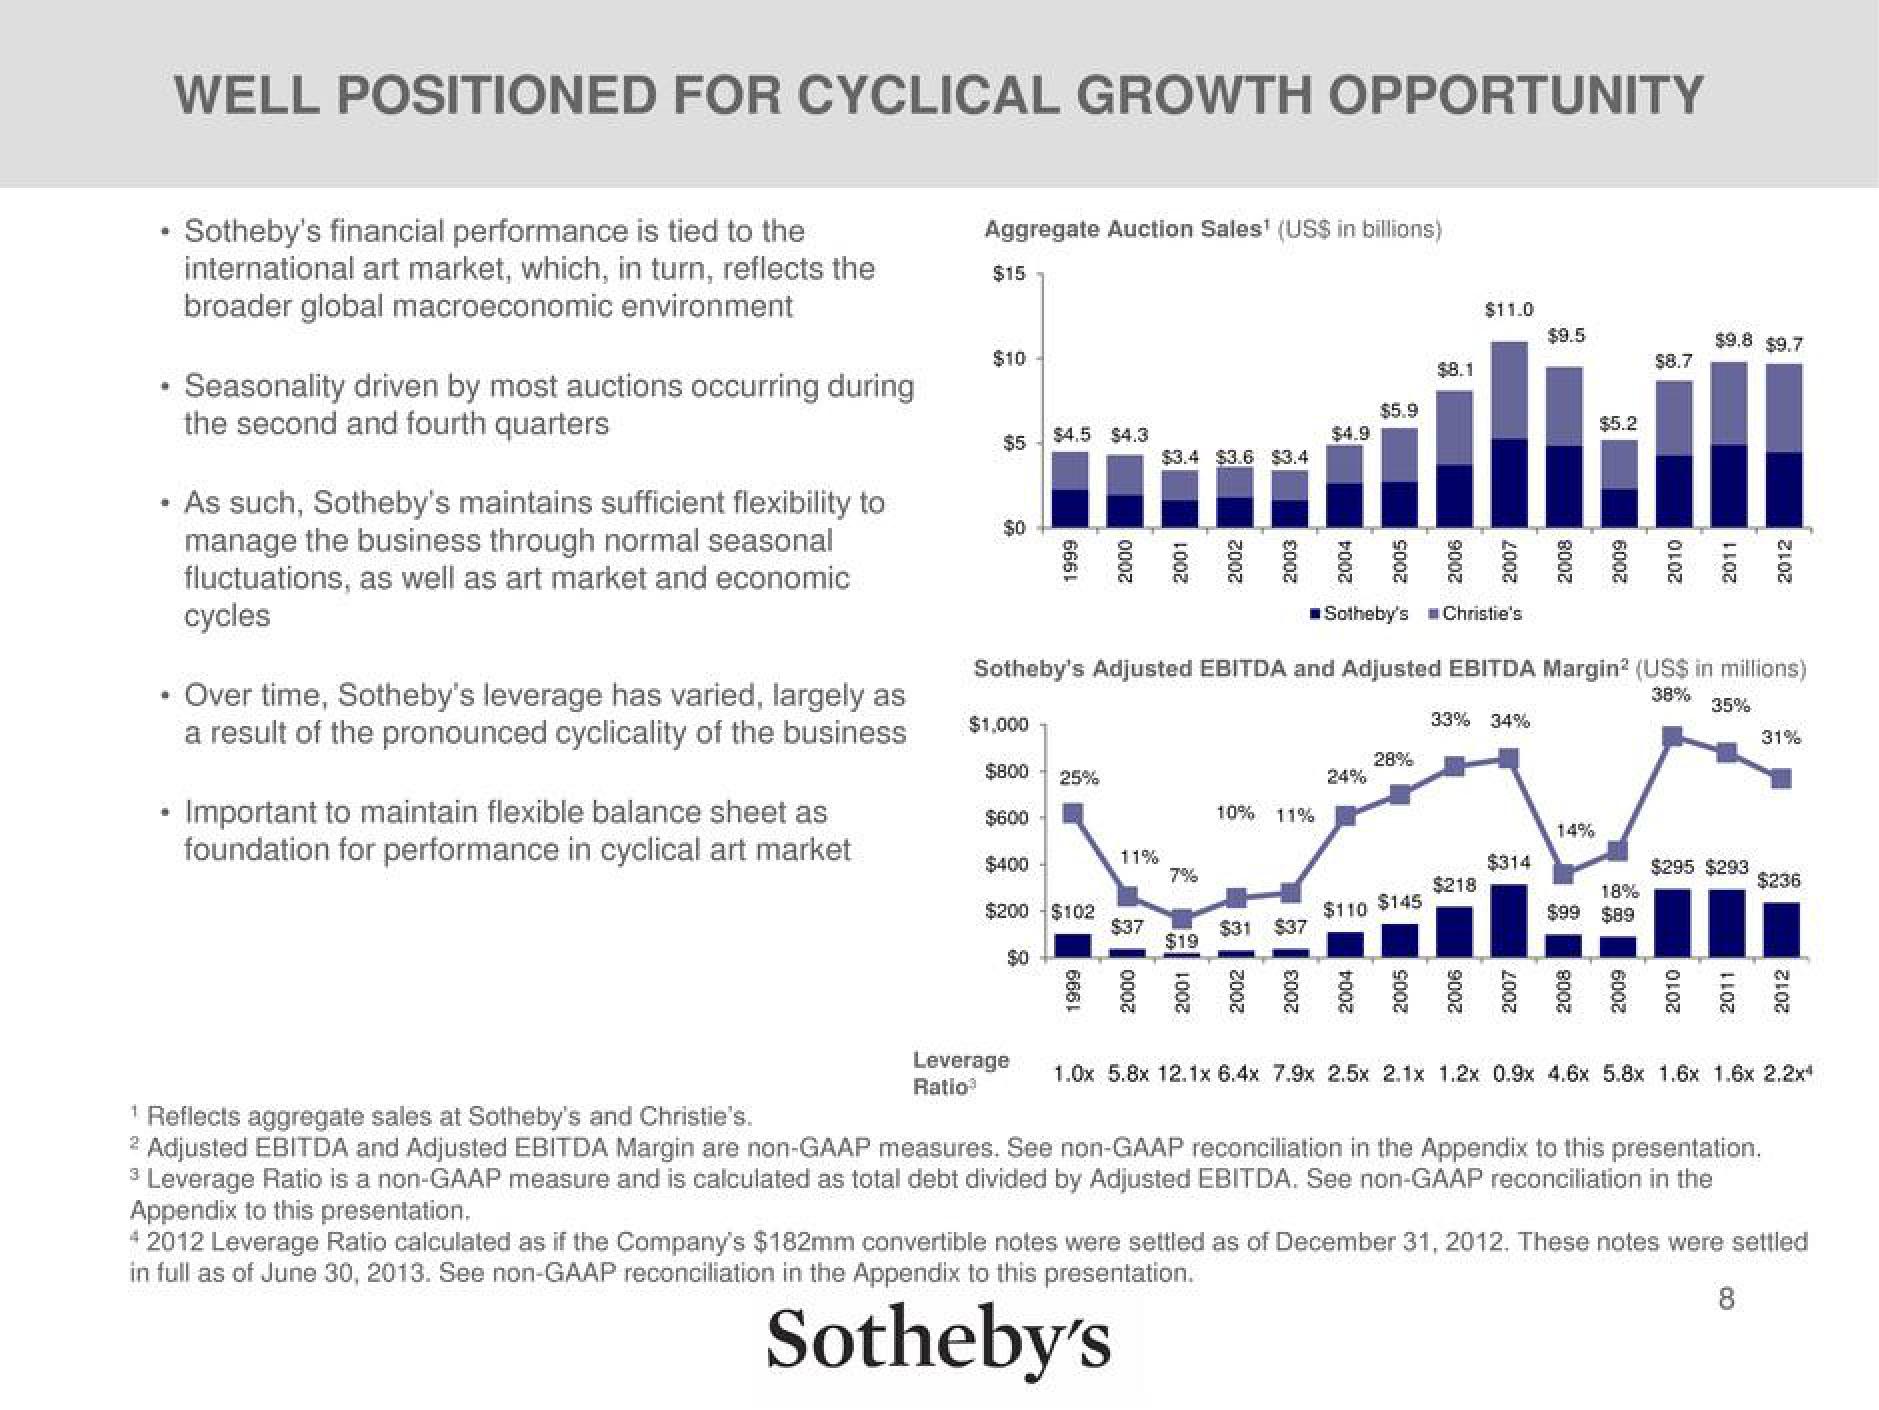
Sotheby's financial performance is tied to the
international art market, which, in turn, reflects the
broader global macroeconomic environment
Seasonality driven by most auctions occurring during
the second and fourth quarters
As such, Sotheby's maintains sufficient flexibility to
manage the business through normal seasonal
fluctuations, as well as art market and economic
cycles
Over time, Sotheby's leverage has varied, largely as
a result of the pronounced cyclicality of the business
• Important to maintain flexible balance sheet as
foundation for performance in cyclical art market
Aggregate Auction Sales¹ (US$ in billions)
$15
$10
$5
$0
$1,000
$800
$4.5 $4.3
8
6661
$0
$600
$400
$200 $102
25%
6661
Sotheby's Christie's
Sotheby's Adjusted EBITDA and Adjusted EBITDA Margin² (US$ in millions)
38%
35%
11%
$3.4 $3.6 $3.4
$37
7%
2000 €
2001
$19
10% 11%
$31 $37
$5.9
2002
2003 4
28%
$8.1
$110 $145
$11.0
33% 34%
$218
$9.5
$314
$5.2
14%
$8.7
18%
$99 $89
$9.8 $9.7
$295 $293
31%
$236
N
Leverage 1.0x 5.8x 12.1x 6.4x 7.9x 2.5x 2.1x 1.2x 0.9x 4.6x 5.8x 1.6x 1.6x 2.2x¹
Ratio
¹ Reflects aggregate sales at Sotheby's and Christie's.
2 Adjusted EBITDA and Adjusted EBITDA Margin are non-GAAP measures. See non-GAAP reconciliation in the Appendix to this presentation.
3 Leverage Ratio is a non-GAAP measure and is calculated as total debt divided by Adjusted EBITDA. See non-GAAP reconciliation in the
Appendix to this presentation.
4 2012 Leverage Ratio calculated as if the Company's $182mm convertible notes were settled as of December 31, 2012. These notes were settled
8
in full as of June 30, 2013. See non-GAAP reconciliation in the Appendix to this presentation.
Sotheby'sView entire presentation