Better SPAC Presentation Deck
Our business model
is asset light as a
result of GSE
takeout, and
augmented through
our Investor
Matching Engine
1. Percent of non-Ally loan origination volume in 2020
2. Source: Urban Institute. Housing Finance at a Glance, April 2020.
First Lien Origination Volume 2001-2019
3. Source: Securities Industry and Financial Markets Association (TBA
MARKET FACT SHEET, 2015)
Better
Government-Supported Liquidity
98% of our loans are conforming¹, and can be sold to the GSES
PennyMac®
Dynamic Investor Matching Engine
Additional alpha through real-time marketplace, maximizing loan-by-loan revenue across 30+
institutional investors
ANNALY
ally
Flagstar
Bank
ArcHome
WELLS
FARGO
$1 Trillion +
Annual GSE & FHA Securitized Volume
over last 10 years²
GALTON FUNDING cooper
Citi TRUIST
CALIBER
HOME LOANS
Lakeview
LOAN SERVICING
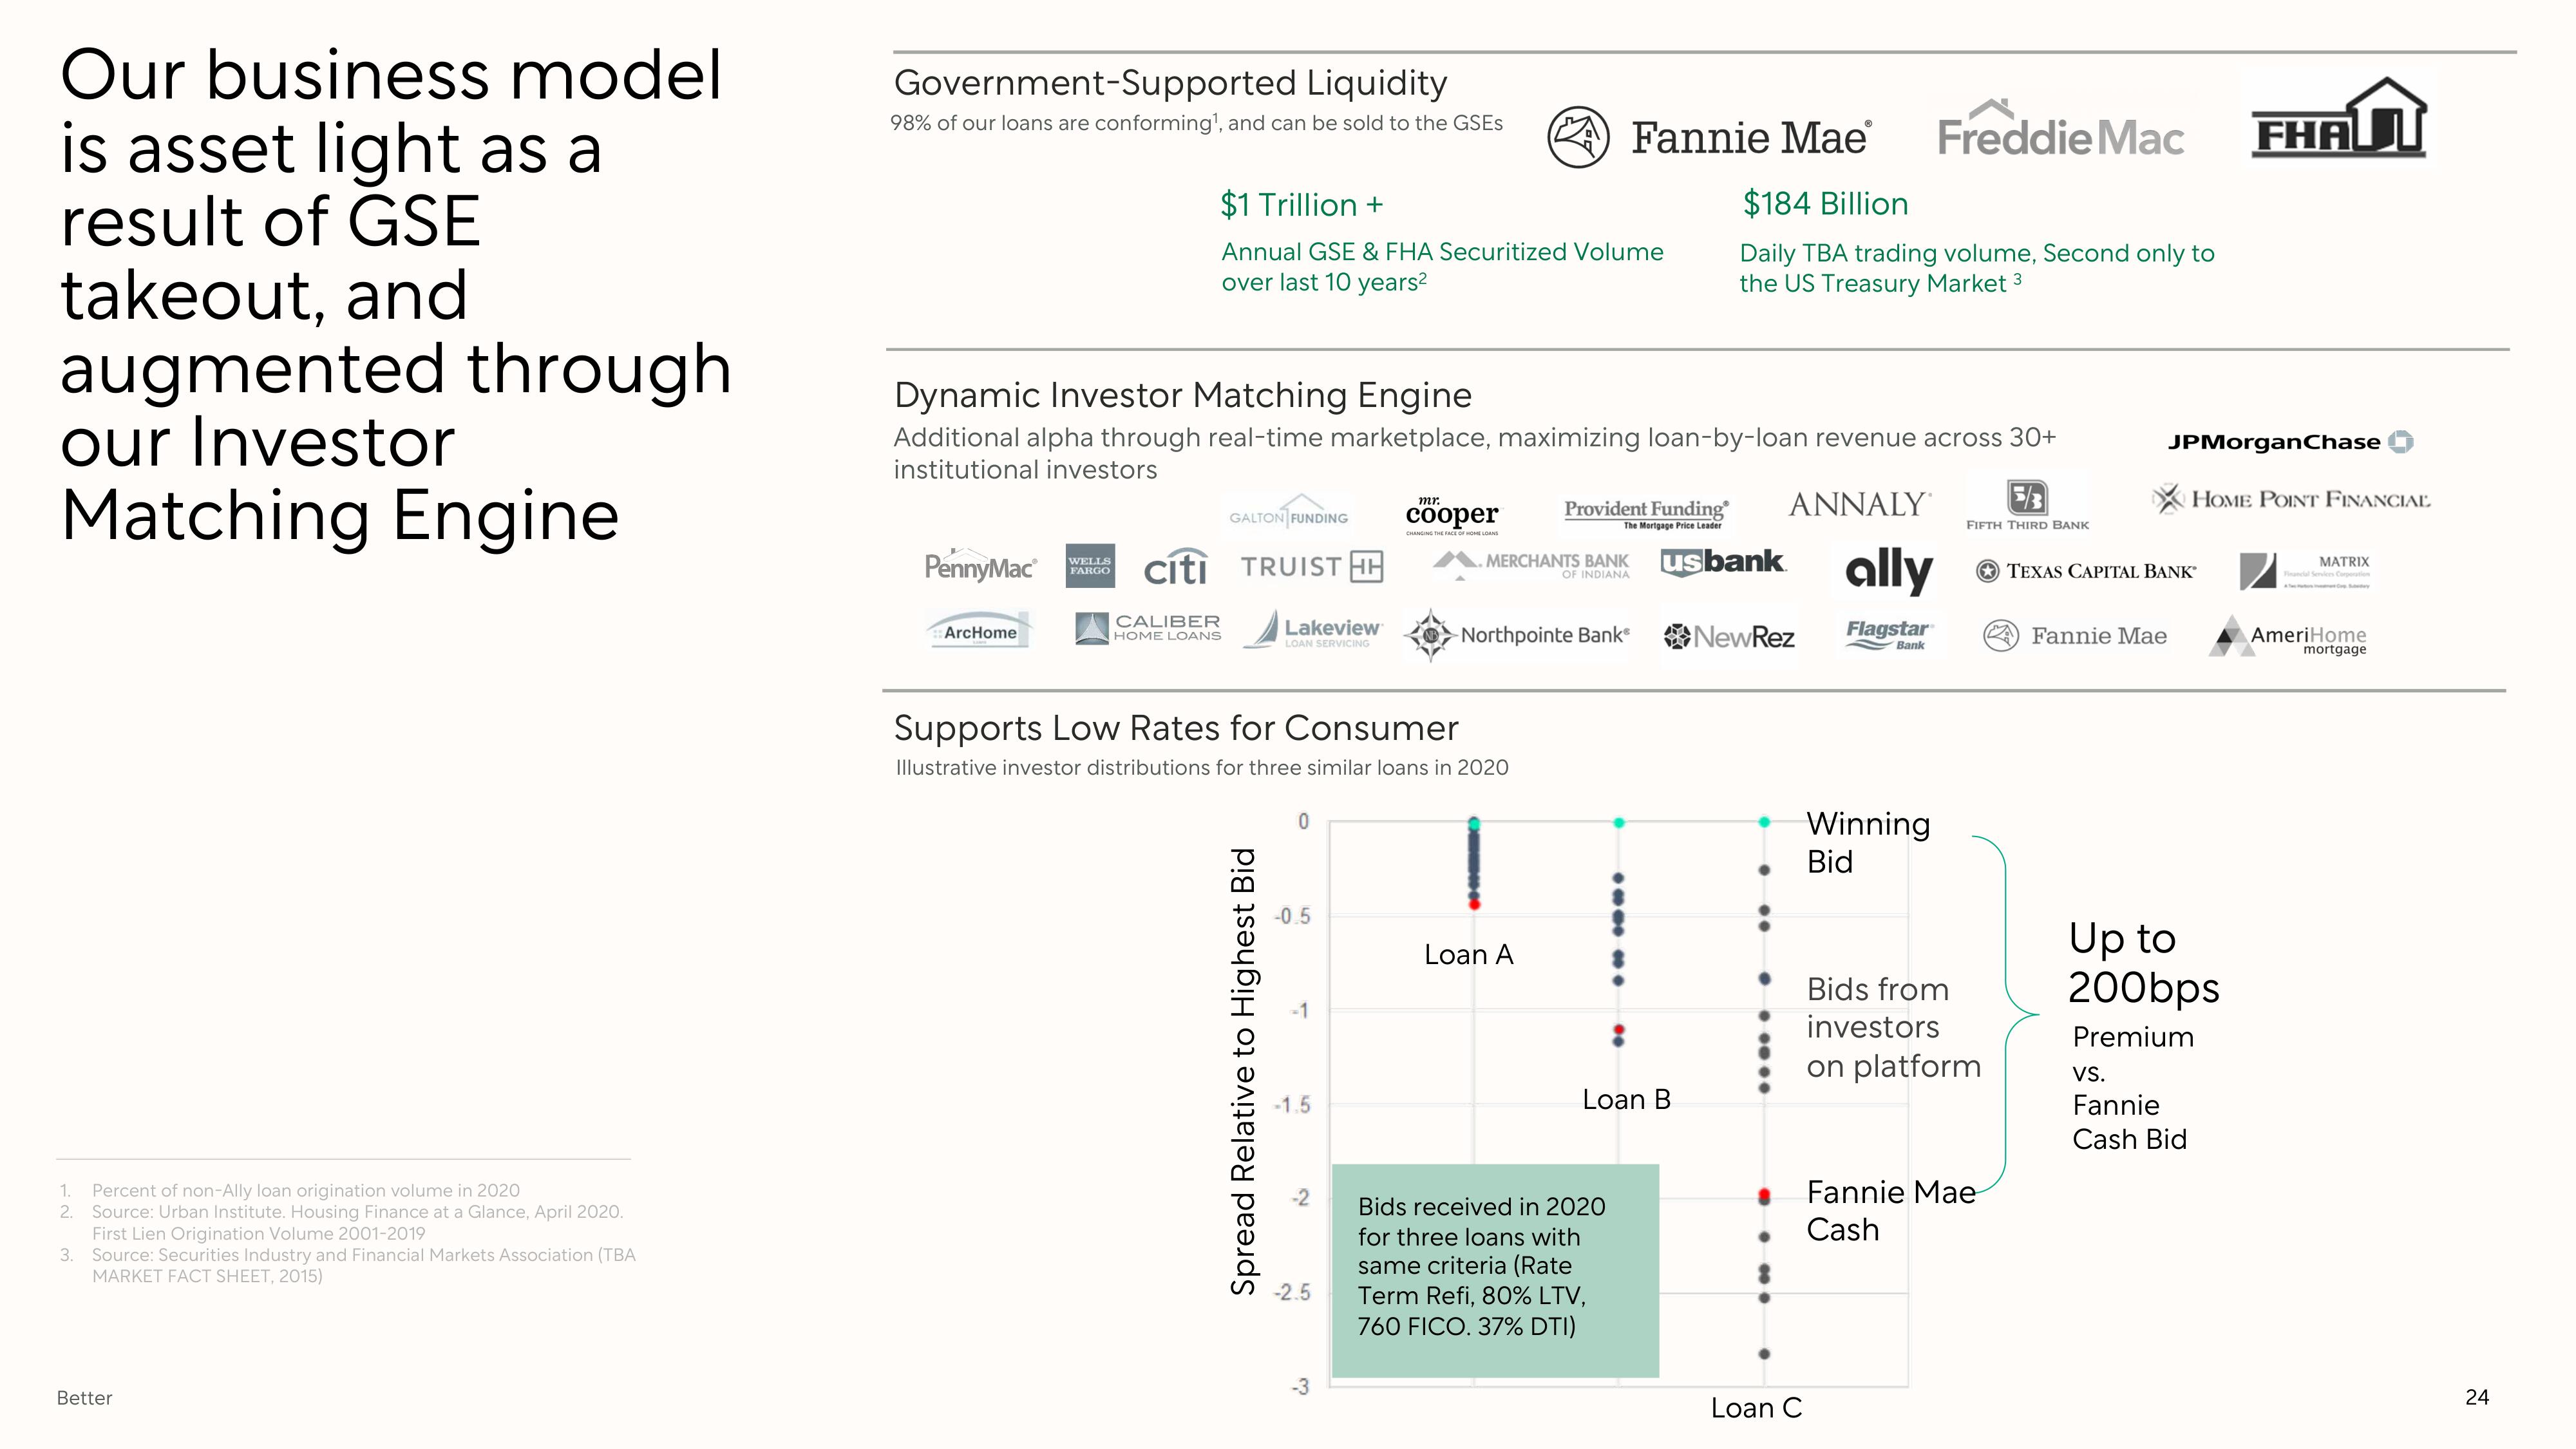
Spread Relative to Highest Bid
Supports Low Rates for Consumer
Illustrative investor distributions for three similar loans in 2020
-0.5
-1.5
-2.5
-3
MERCHANTS BANK
OF INDIANA
-Northpointe Bank
Fannie Mae Freddie Mac
$184 Billion
Daily TBA trading volume, Second only to
the US Treasury Market 3
Provident Funding
The Mortgage Price Leader
Loan A
Bids received in 2020
for three loans with
same criteria (Rate
Term Refi, 80% LTV,
760 FICO. 37% DTI)
usbank
Loan B
NewRez
Loan C
Winning
Bid
5/3
FIFTH THIRD BANK
Bids from
investors
on platform
Fannie Mae
Cash
JPMorgan Chase
HOME POINT FINANCIAL
TEXAS CAPITAL BANK
Fannie Mae
Up to
200bps
Premium
FHAU
VS.
Fannie
Cash Bid
MATRIX
AmeriHome
mortgage
24View entire presentation