Comcast Results Presentation Deck
Sky 3rd Quarter 2020 Overview
9
Customer Relationships
23.9
+2%
3Q 19
Revenue
$4,554
3Q 19
24.0
+2%
4Q 19
+0.3%
$4,793
3Q20
23.9
+1%
1Q20
23.7
(1%)
3Q 19
2Q20
$899
All percentages represent year/year constant currency growth rates.
See Notes on Slide 14
23.7
(1%)
($M) Adjusted EBITDA ($M)
3Q20
(45.4%)
(M)
$515
3Q 20
Commentary
●
●
●
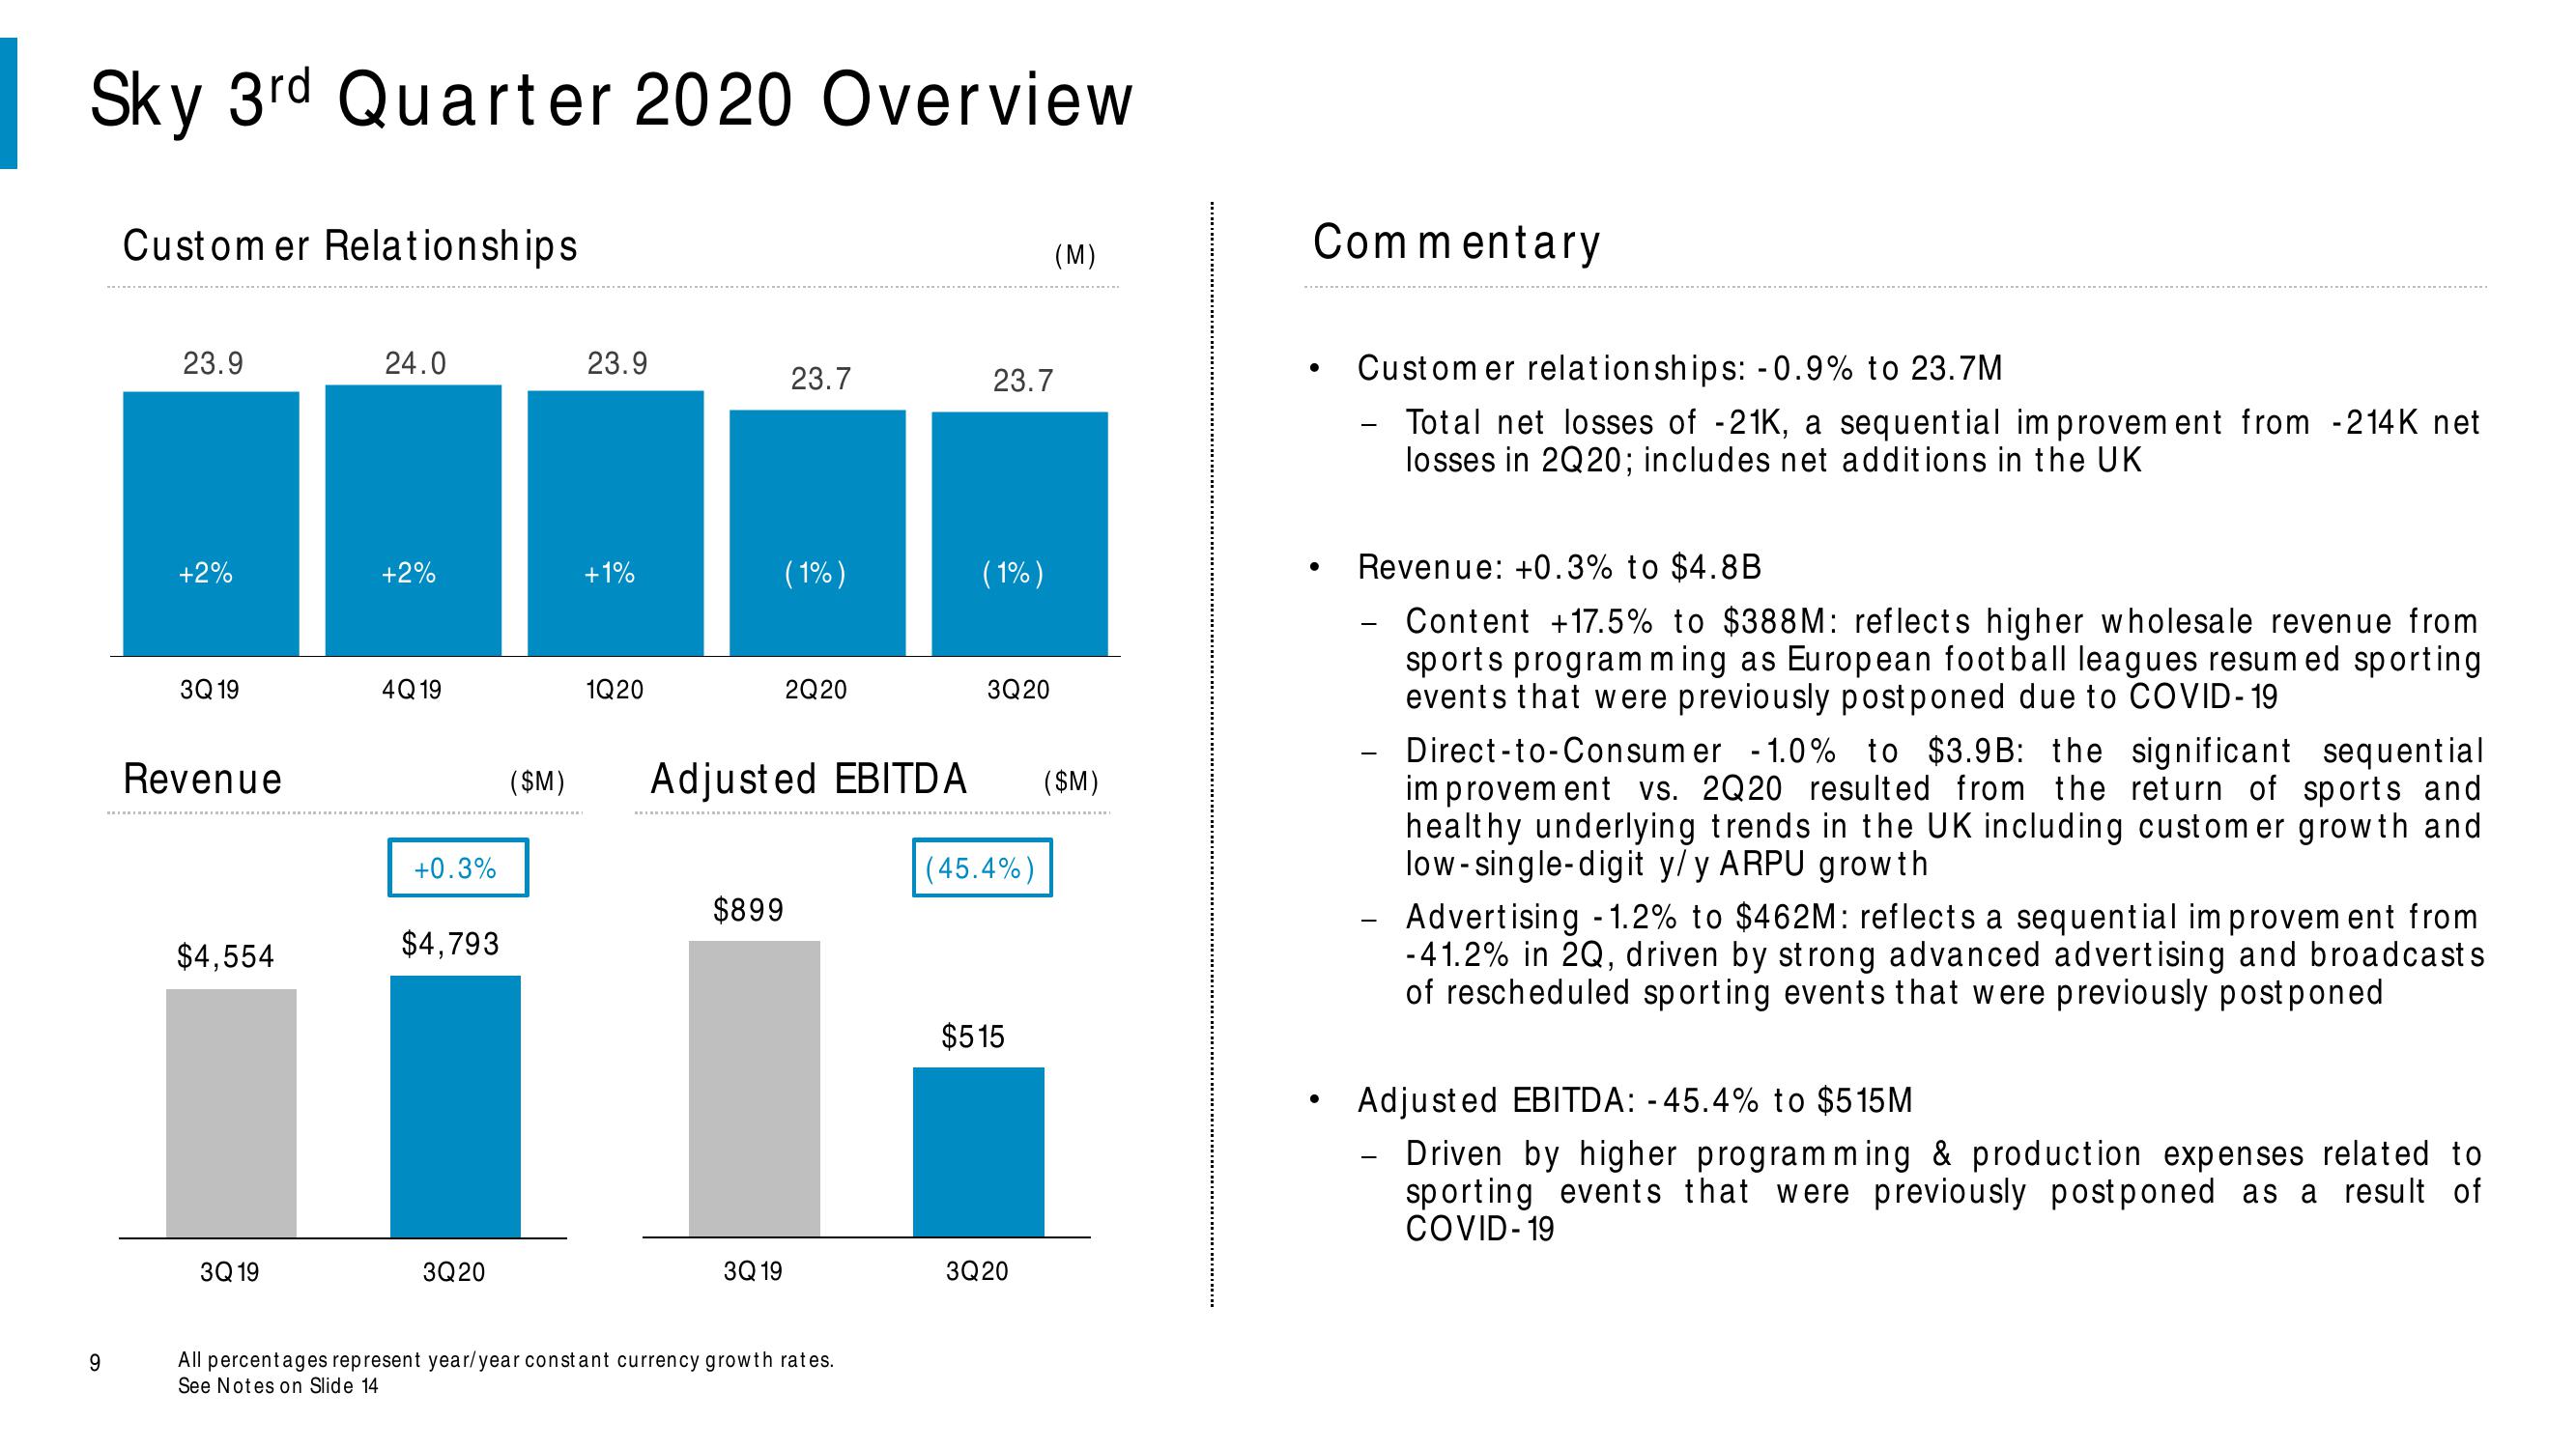
Customer relationships: -0.9% to 23.7M
Total net losses of -21K, a sequential improvement from -214K net
losses in 2Q20; includes net additions in the UK
Revenue: +0.3% to $4.8B
Content +17.5% to $388M: reflects higher wholesale revenue from
sports programming as European football leagues resumed sporting
events that were previously postponed due to COVID-19
-
Direct-to-Consumer -1.0% to $3.9B: the significant sequential
improvement vs. 2Q20 resulted from the return of sports and
healthy underlying trends in the UK including customer growth and
low-single-digit y/y ARPU growth
Advertising - 1.2% to $462M: reflects a sequential improvement from
-41.2% in 2Q, driven by strong advanced advertising and broadcasts
of rescheduled sporting events that were previously postponed
Adjusted EBITDA: -45.4% to $515M
Driven by higher programming & production expenses related to
sporting events that were previously postponed as a result of
COVID-19View entire presentation