Uber Results Presentation Deck
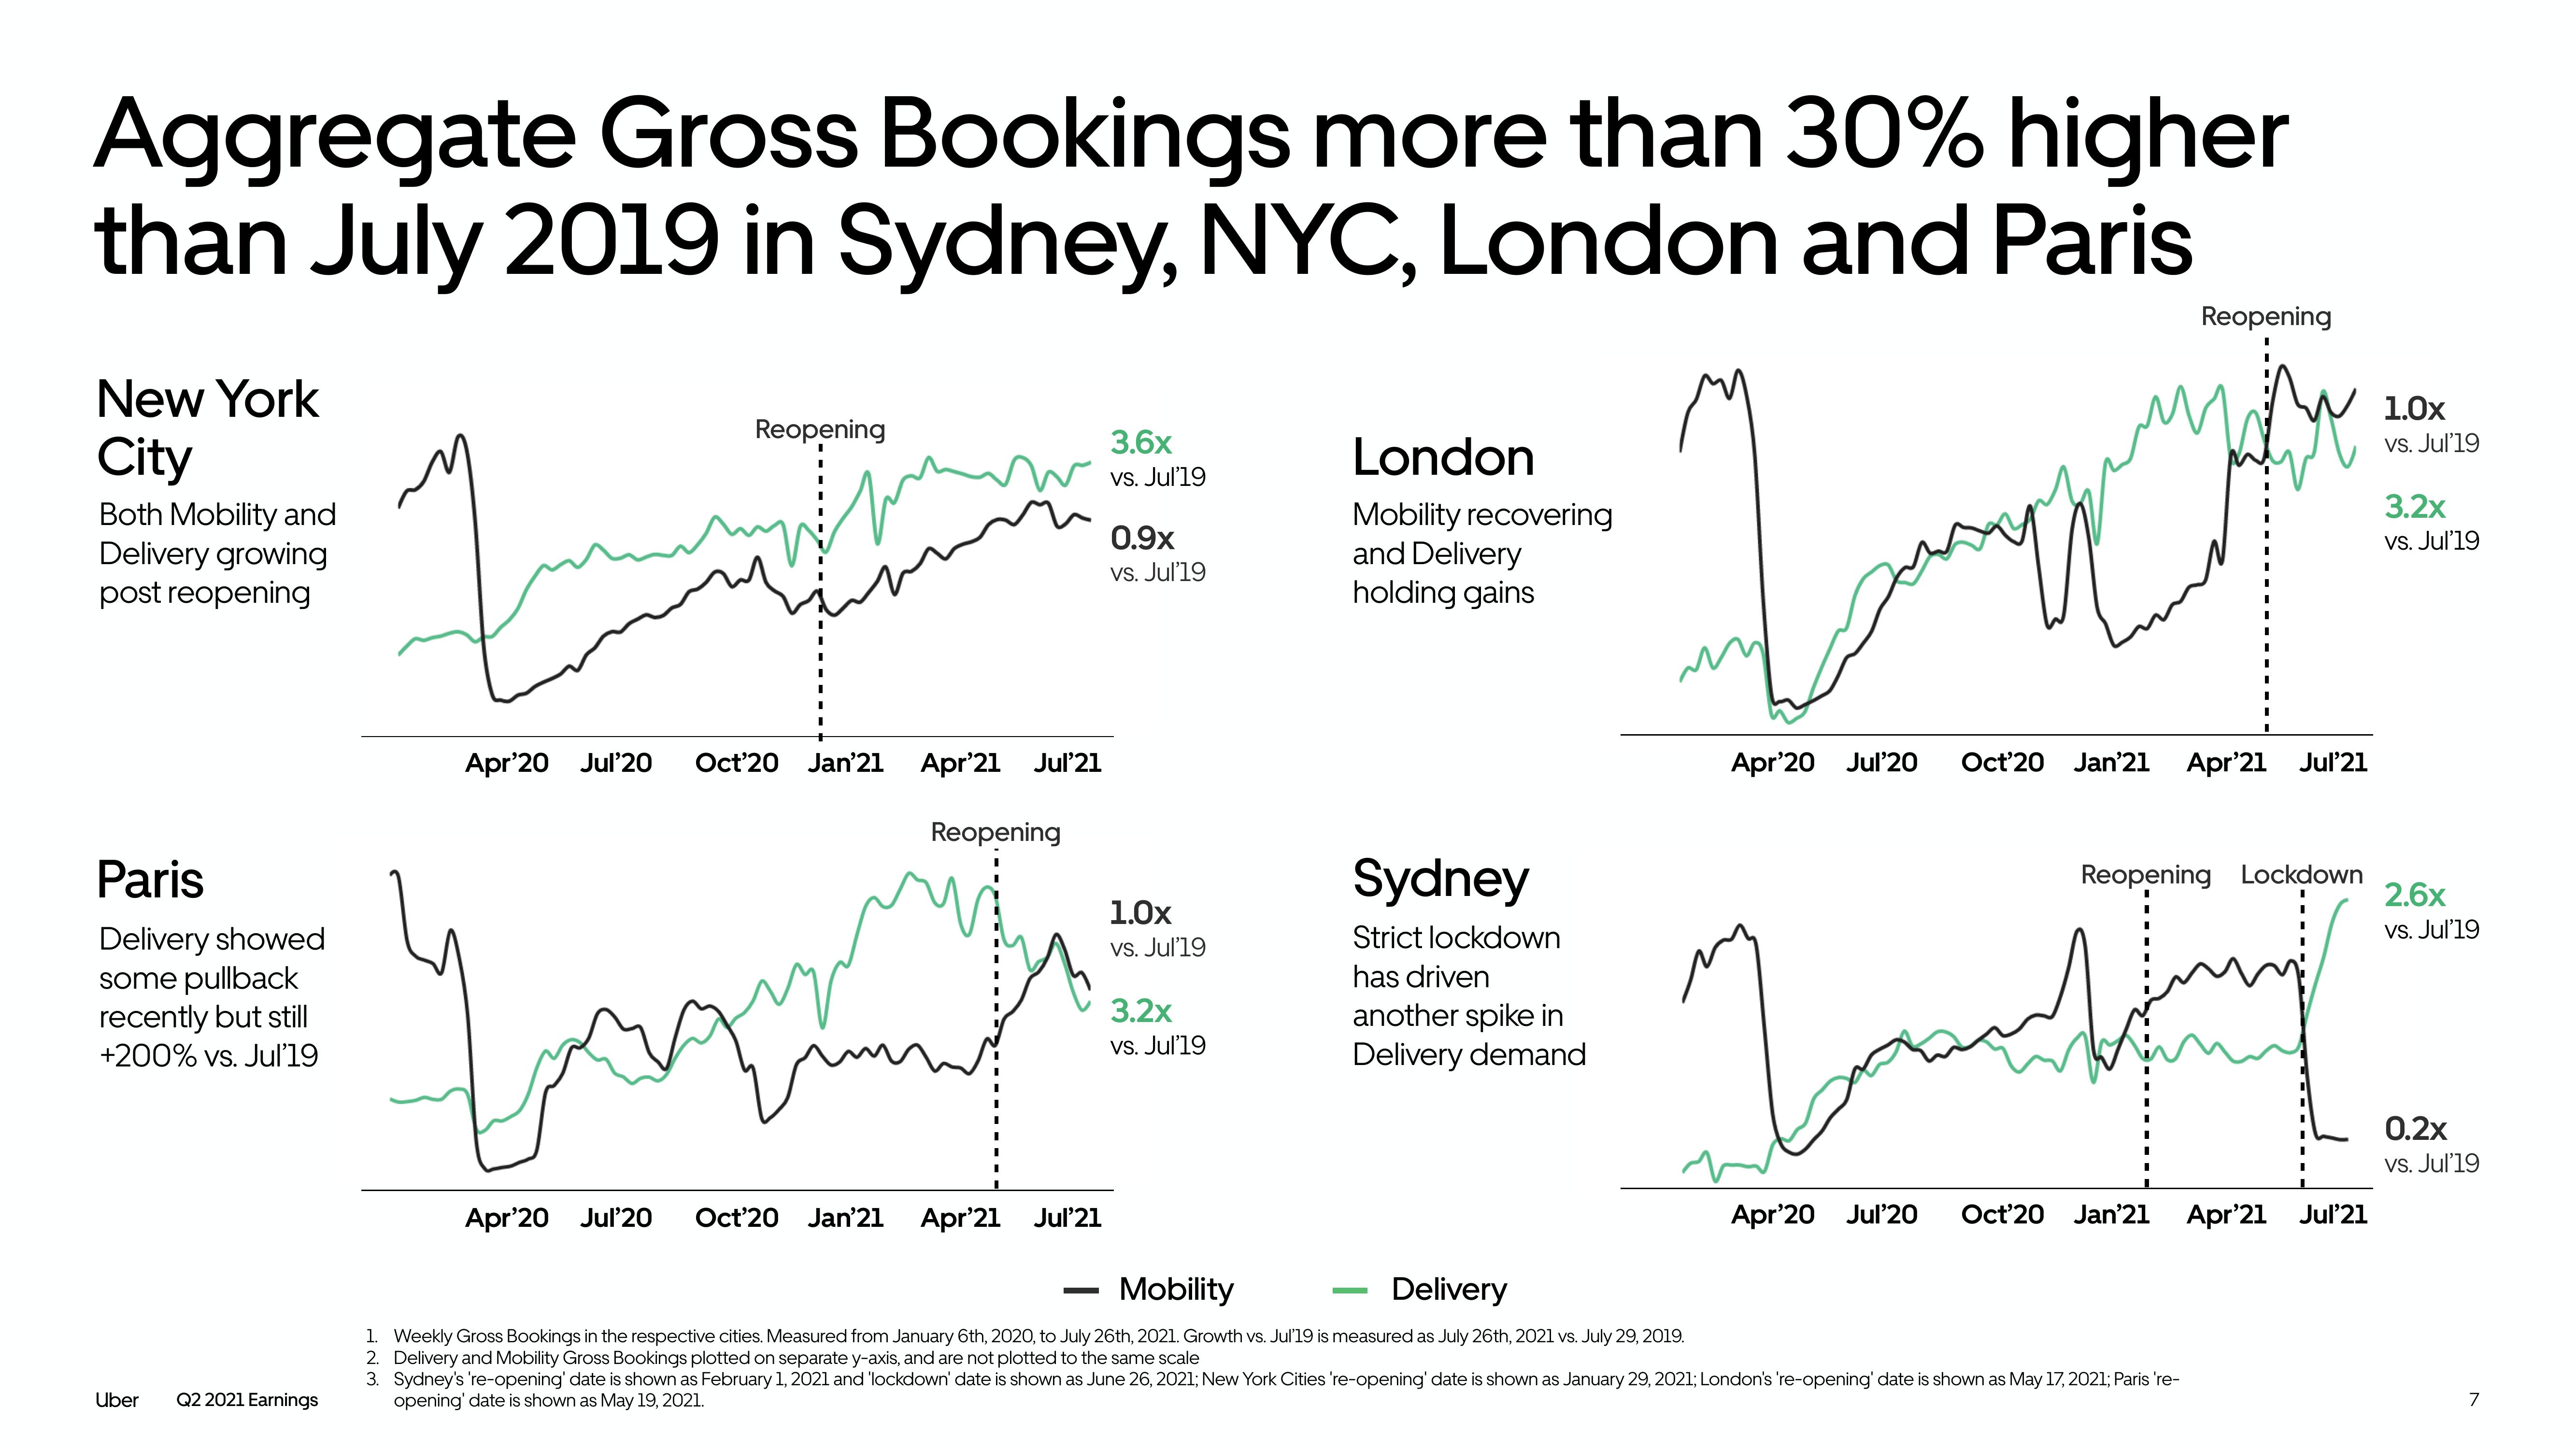
Aggregate Gross Bookings more than 30% higher
than July 2019 in Sydney, NYC, London and Paris
Lap
New York
City
Both Mobility and
Delivery growing
post reopening
Paris
Delivery showed
some pullback
recently but still
+200% vs. Jul'19
Uber
Q2 2021 Earnings
Reopening
Apr 20 Jul 20 Oct 20 Jan'21 Apr¹21 Jul'21
Apr 20 Jul 20
Reopening
Oct 20 Jan'21 Apr¹21
Jul'21
3.6x
vs. Jul'19
0.9x
vs. Jul'19
1.0x
vs. Jul'19
3.2x
vs. Jul'19
London
Mobility recovering
and Delivery
holding gains
Sydney
Strict lockdown
has driven
another spike in
Delivery demand
Apr¹20 Jul 20
Oct 20
Ins
Apr 20 Jul 20
Oct 20
Jan'21 Apr'21 Jul 21
Reopening
Reopening Lockdown
Jan'21
my
Mobility
Delivery
1. Weekly Gross Bookings in the respective cities. Measured from January 6th, 2020, to July 26th, 2021. Growth vs. Jul'19 is measured as July 26th, 2021 vs. July 29, 2019.
2. Delivery and Mobility Gross Bookings plotted on separate y-axis, and are not plotted to the same scale
3. Sydney's 're-opening' date is shown as February 1, 2021 and 'lockdown' date is shown as June 26, 2021; New York Cities 're-opening' date is shown as January 29, 2021; London's 're-opening' date is shown as May 17, 2021; Paris 're-
opening' date is shown as May 19, 2021.
Apr'21 Jul 21
1.0x
vs. Jul'19
3.2x
vs. Jul'19
2.6x
vs. Jul'19
0.2x
vs. Jul'19
7View entire presentation