Telia Company Results Presentation Deck
IMPROVED SERVICE REVENUE AND EBITDA TRENDS
3
SERVICE REVENUE DEVELOPMENT*
Organic & like for like growth, external service revenues
Service revenue growth
Growth excl. Telia Carrier
Growth excl. Telia Carrier & Sweden fiber OTC Q4 2019
●
Q4 18
Q1 19
Q2 19
Q3 19
-0.6%
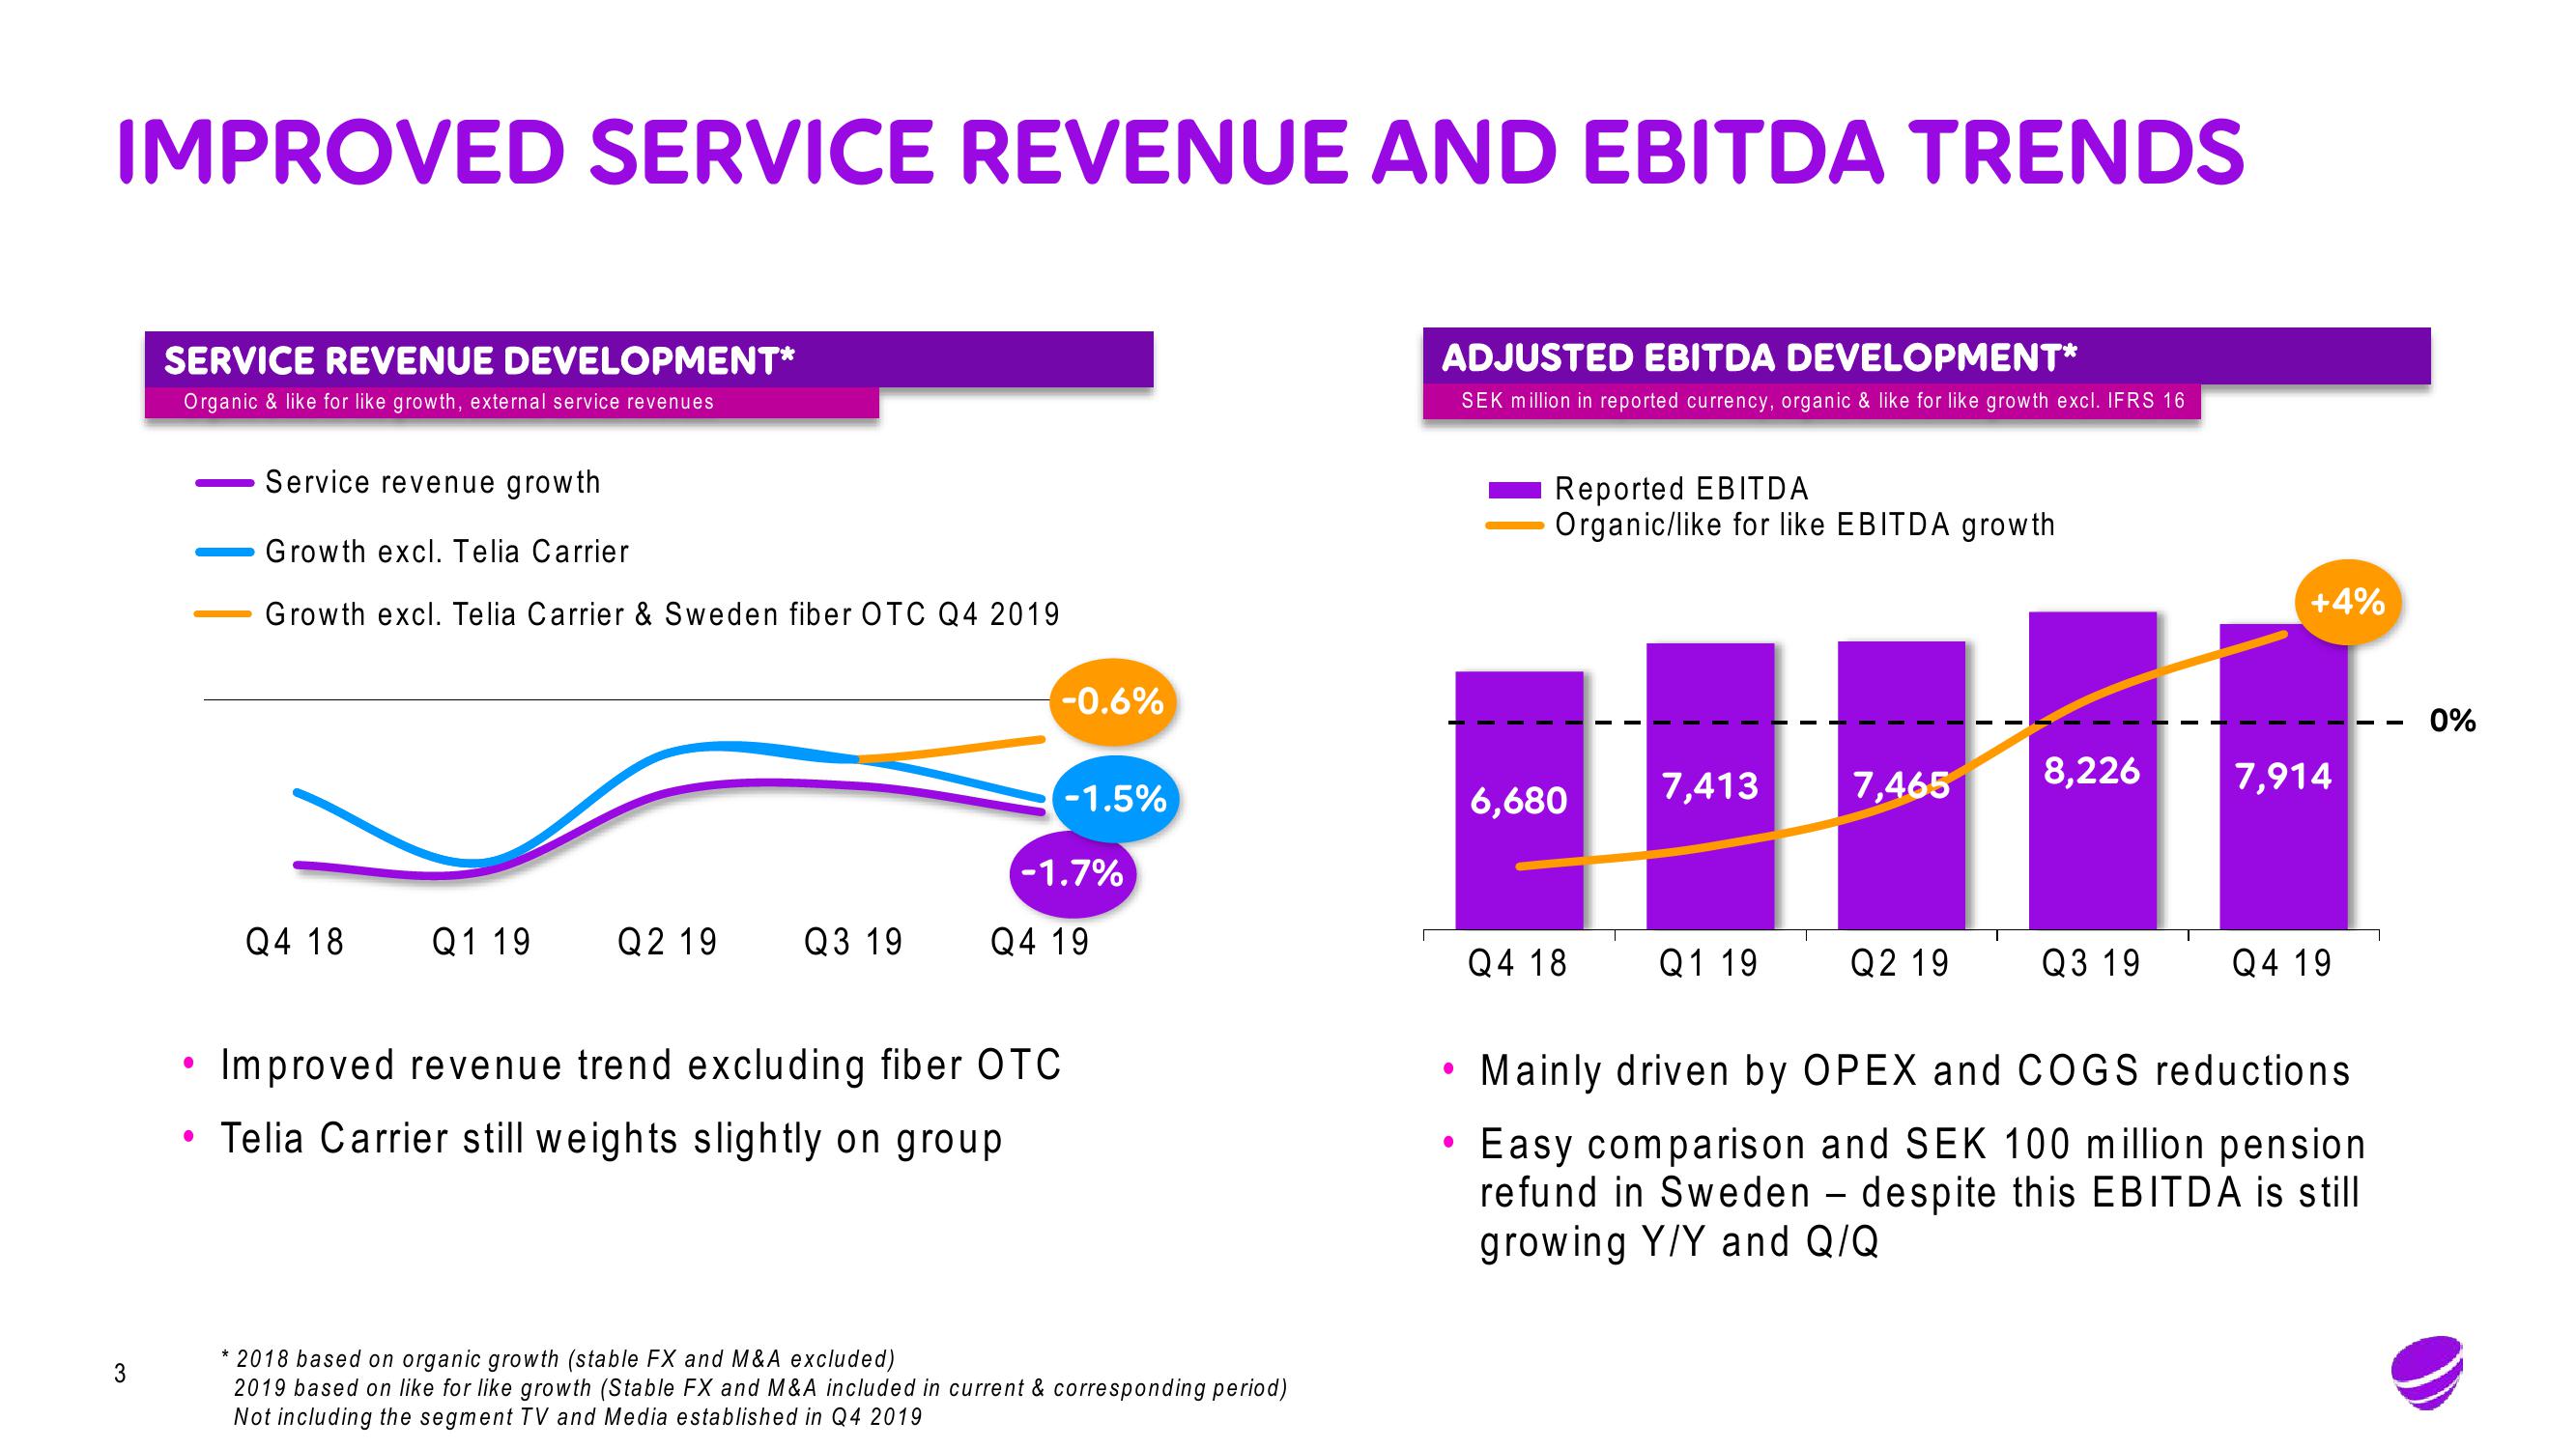
Improved revenue trend excluding fiber OTC
●
• Telia Carrier still weights slightly on group
-1.5%
-1.7%
Q4 19
* 2018 based on organic growth (stable FX and M&A excluded)
2019 based on like for like growth (Stable FX and M&A included in current & corresponding period)
Not including the segment TV and Media established in Q4 2019
ADJUSTED EBITDA DEVELOPMENT*
SEK million in reported currency, organic & like for like growth excl. IFRS 16
●
●
Reported EBITDA
Organic/like for like EBITDA growth
6,680
Q4 18
7,413
Q1 19
7,465
Q2 19
8,226
Q3 19
+4%
7,914
Q4 19
Mainly driven by OPEX and COGS reductions
Easy comparison and SEK 100 million pension.
refund in Sweden - despite this EBITDA is still
growing Y/Y and Q/Q
0%View entire presentation