Bank of America Investment Banking Pitch Book
Appendix
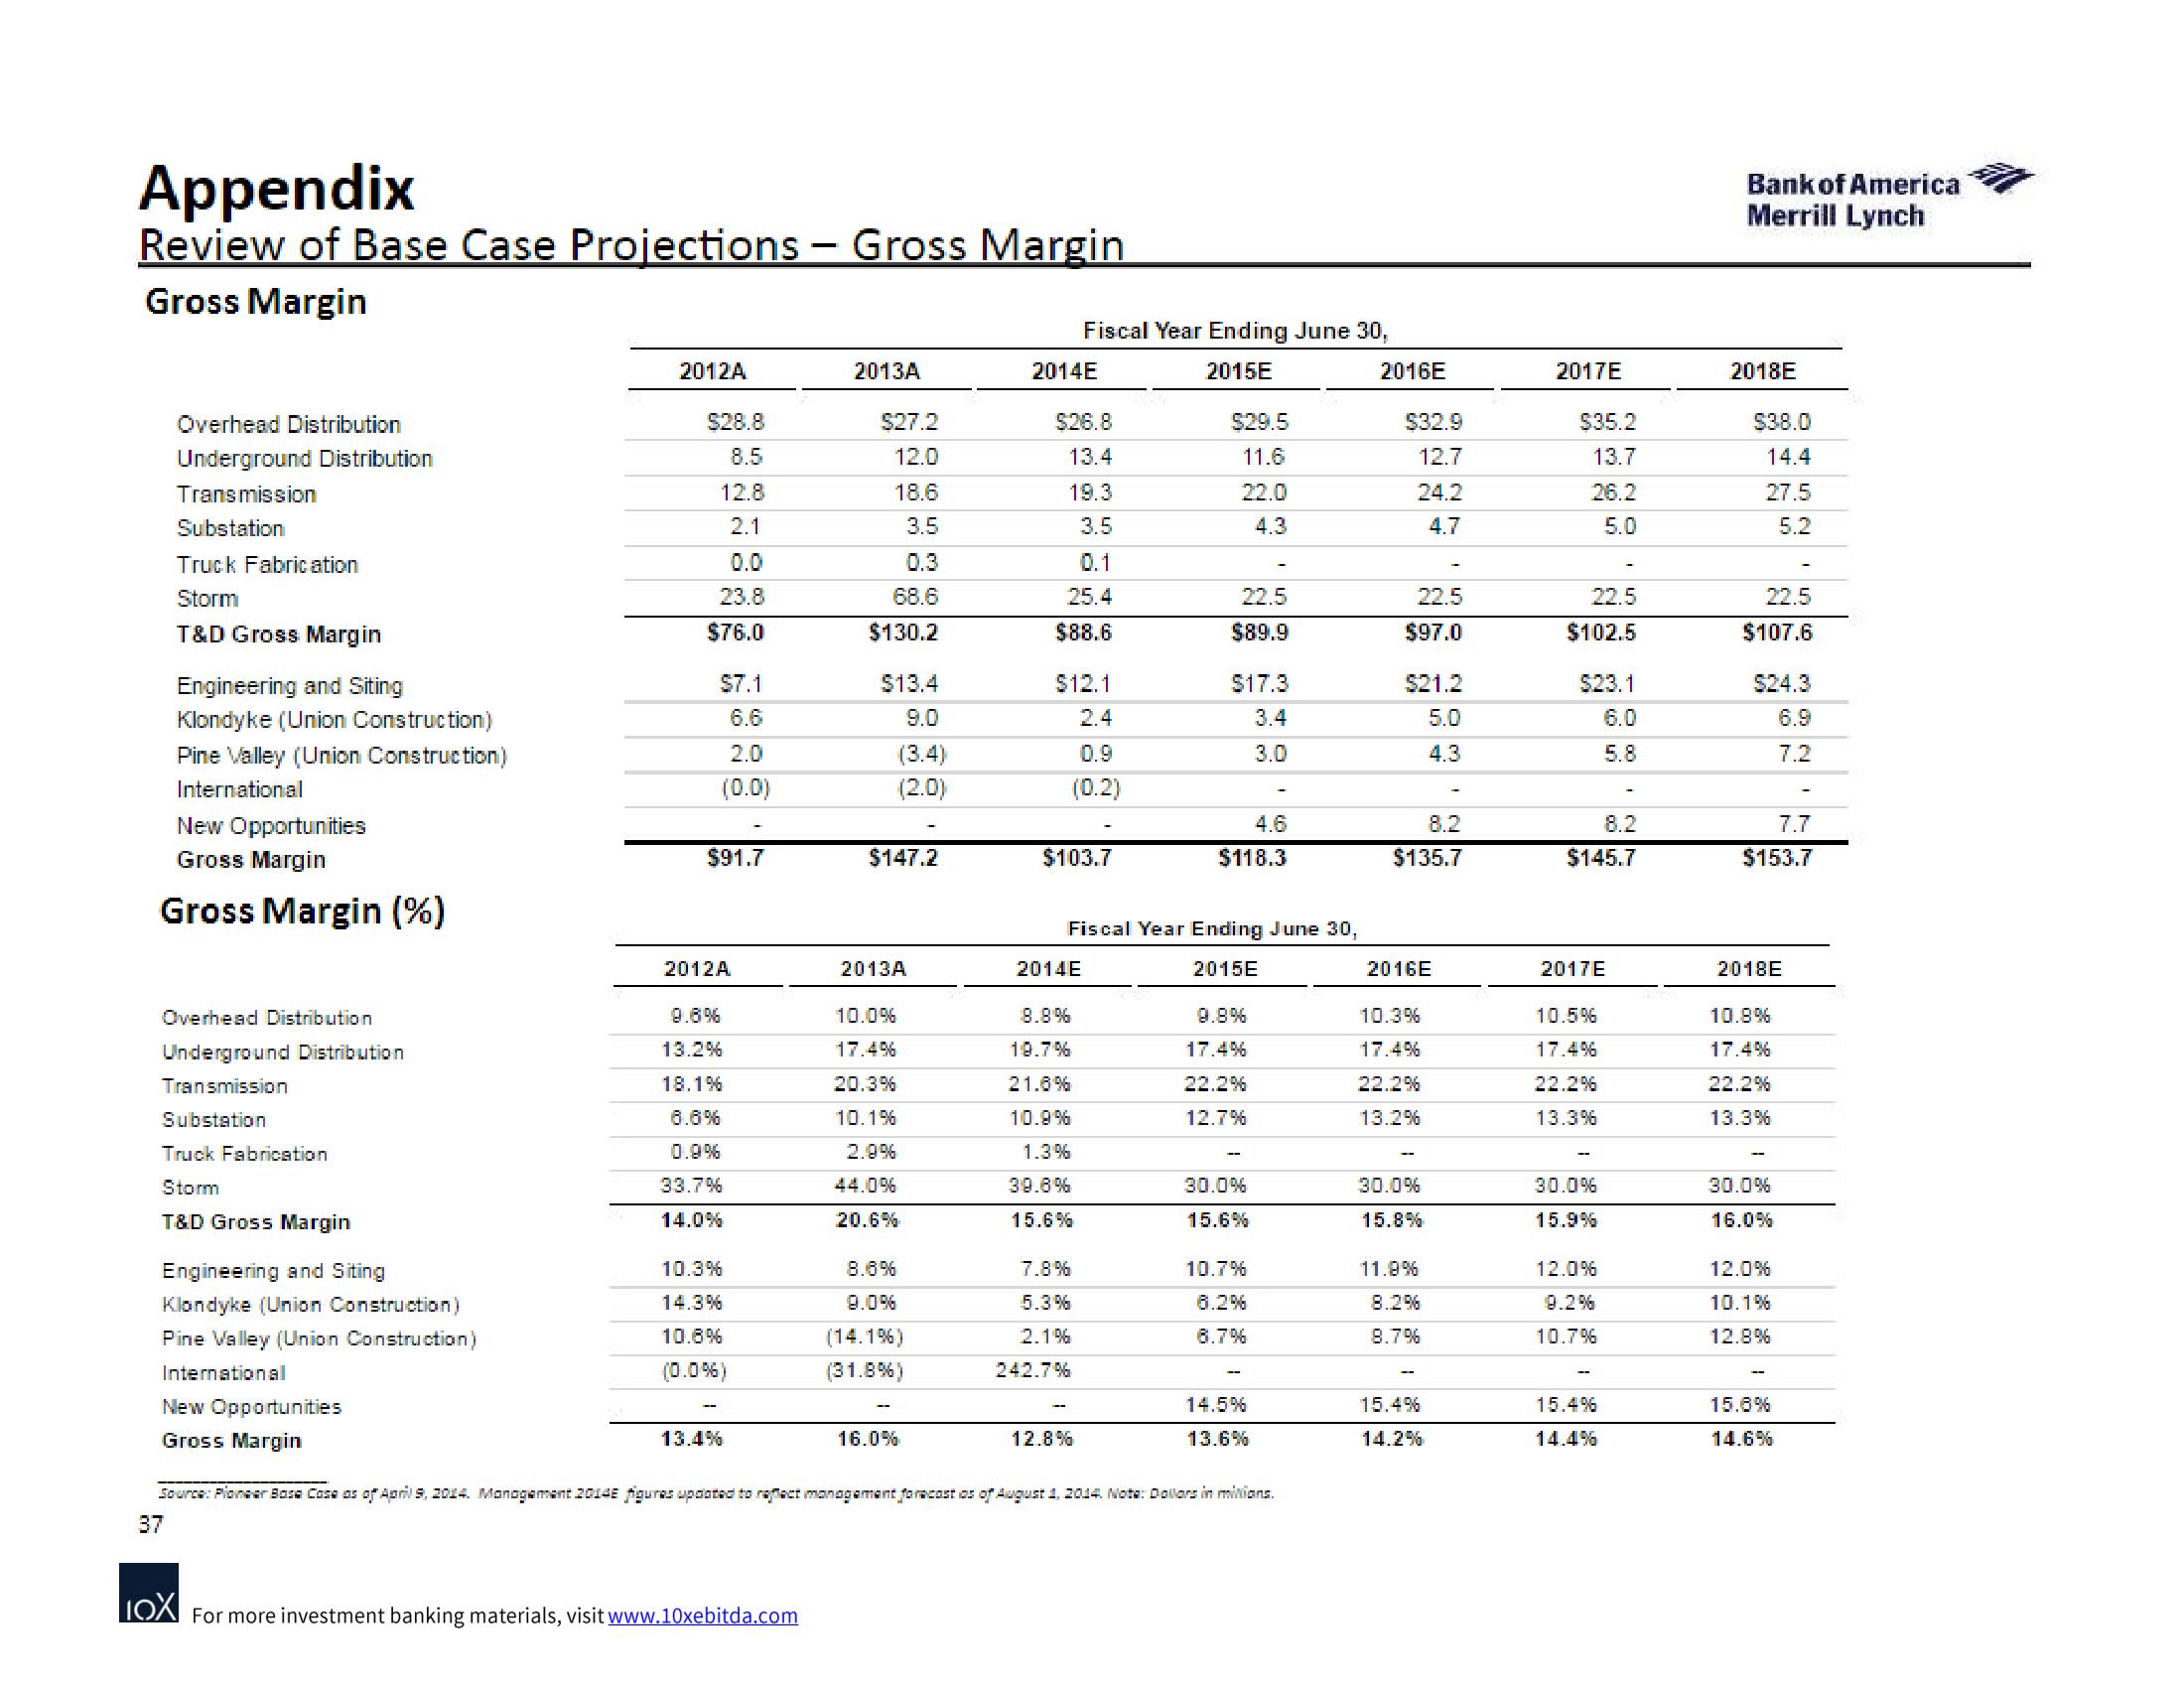
Review of Base Case Projections - Gross Margin
Gross Margin
Overhead Distribution
Underground Distribution
Transmission
Substation
Truck Fabrication
Storm
T&D Gross Margin
Engineering and Siting
Klondyke (Union Construction)
Pine Valley (Union Construction)
International
New Opportunities
Gross Margin
Gross Margin (%)
Overhead Distribution
Underground Distribution
Transmission
Substation
Truck Fabrication
Storm
T&D Gross Margin
Engineering and Siting
Klondyke (Union Construction)
Pine Valley (Union Construction)
International
New Opportunities
Gross Margin
2012A
$28.8
8.5
12.8
2.1
23.8
$76.0
$7.1
6.6
2.0
(0.0)
$91.7
NO
2012A
9.8%
13.2%
18.1%
8.6%
0.9%
33.7%
14.0%
10.3%
14.3%
10.8%
(0.0%)
13.4%
2013A
$27.2
12.0
18.6
3.5
0.3
68.6
$130.2
$13.4
9.0
(3.4)
(2.0)
$147.2
2013A
10.0%
17.4%
20.3%
10.1%
2.9%
44.0%
20.6%
8.8%
9.0%
(14.1%)
(31.8%)
16.0%
2014E
$26.8
13.4
19.3
3.5
0.1
25.4
$88.6
$12.1
2.4
0.9
(0.2)
$103.7
Fiscal Year Ending June 30,
2015E
2014E
8.8%
19.7%
21.8%
10.9%
1.3%
39.8%
15.6%
7.8%
5.3%
2.1%
242.7%
-
12.8%
$29.5
11.6
22.0
4.3
Fiscal Year Ending June 30,
2015E
22.5
$89.9
$17.3
3.4
3.0
4.6
$118.3
9.8%
17.4%
22.2%
12.7%
30.0%
15.6%
10.7%
6.2%
8.7%
14.5%
13.6%
Source: Pioneer Bose Cosa as of April 9, 2014. Management 2014E figuras upolated to reflect management forecast as of August 1, 2014. Nota: Dollars in milions.
37
IOX For more investment banking materials, visit www.10xebitda.com
2016E
$32.9
12.7
24.2
4.7
22.5
$97.0
$21.2
5.0
4.3
8.2
$135.7
2016E
10.3%
17.4%
22.2%
13.2%
30.0%
15.8%
11.9%
8.2%
8.7%
15.4%
14.2%
2017E
$35.2
13.7
26.2
5.0
22.5
$102.5
$23.1
6.0
5.8
8.2
$145.7
2017E
10.5%
17.4%
22.2%
13.3%
30.0%
15.9%
12.0%
9.2%
10.7%
15.4%
14.4%
Bank of America
Merrill Lynch
2018E
$38.0
14.4
27.5
5.2
22.5
$107.6
$24.3
6.9
7.2
7.7
$153.7
2018E
10.8%
17.4%
22.2%
13.3%
30.0%
16.0%
12.0%
10.1%
12.8%
15.8%
14.6%View entire presentation