Kore Investor Presentation Deck
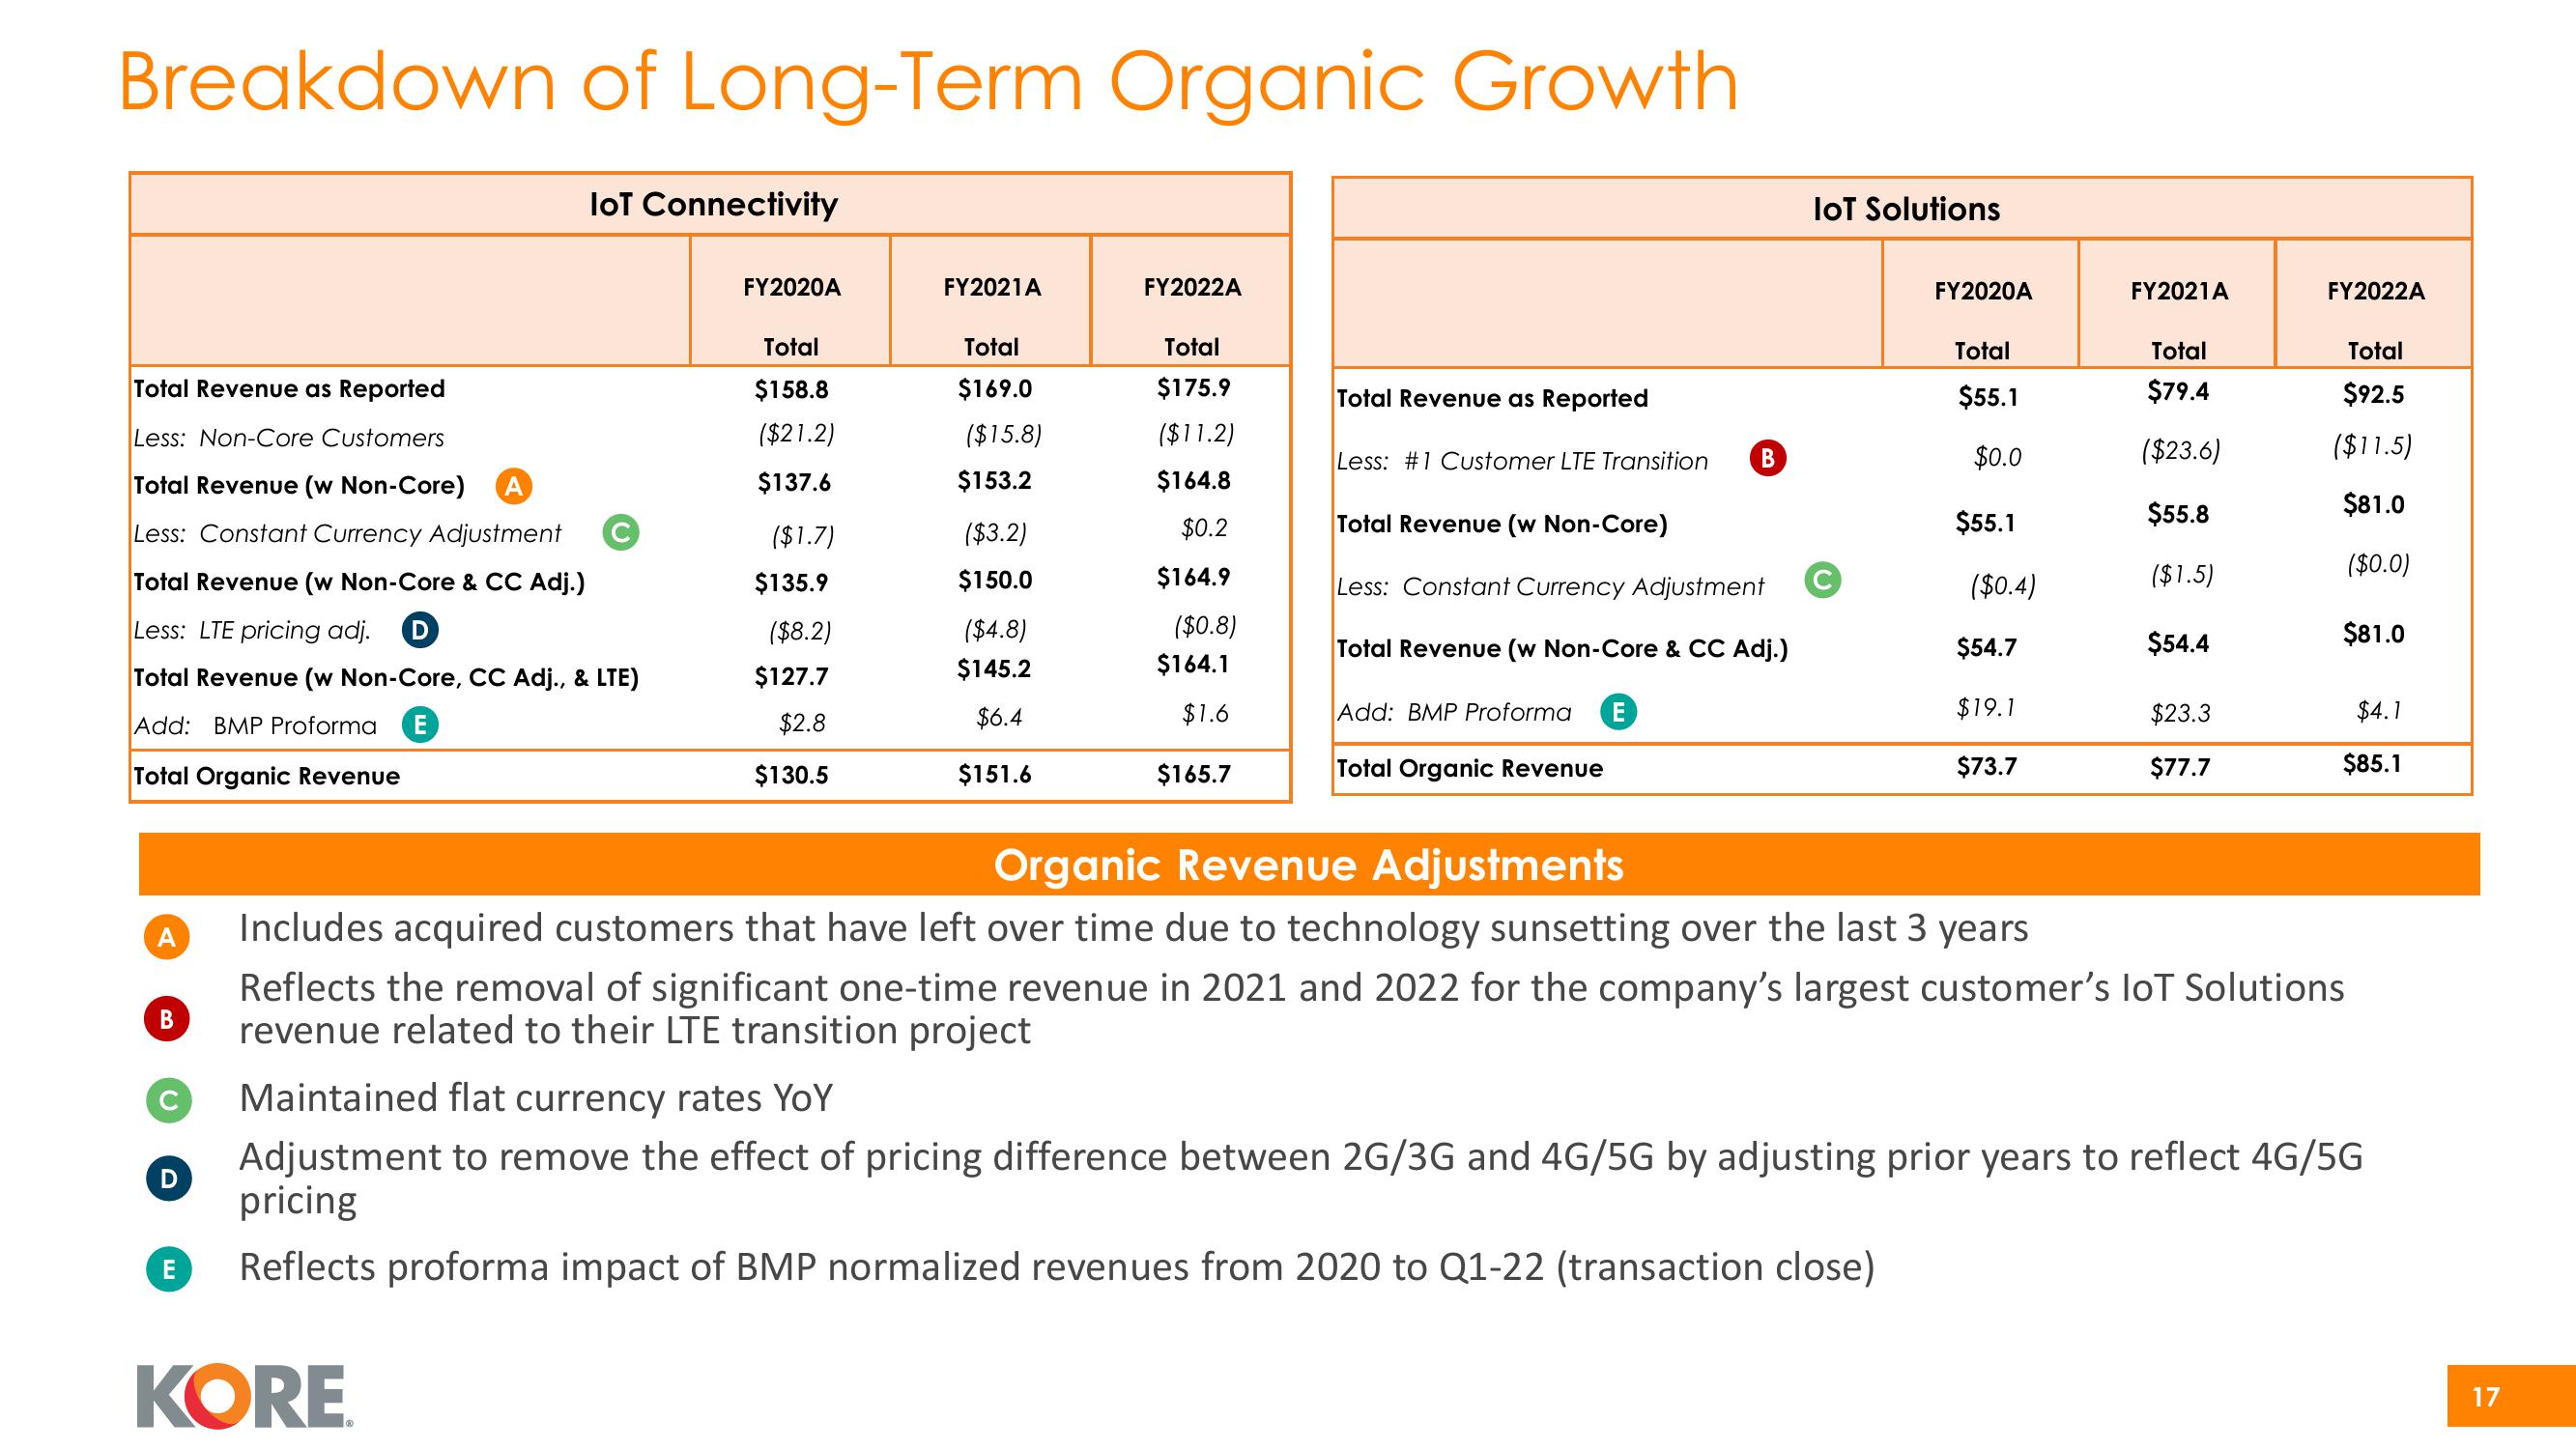
Breakdown of Long-Term Organic Growth
Total Revenue as Reported
Less: Non-Core Customers
Total Revenue (w Non-Core) A
Less: Constant Currency Adjustment
Total Revenue (w Non-Core & CC Adj.)
Less: LTE pricing adj. D
Total Revenue (w Non-Core, CC Adj., & LTE)
Add: BMP Proforma
E
Total Organic Revenue
A
B
D
E
IoT Connectivity
FY2020A
KORE
Total
$158.8
($21.2)
$137.6
($1.7)
$135.9
($8.2)
$127.7
$2.8
$130.5
FY2021A
Total
$169.0
($15.8)
$153.2
($3.2)
$150.0
($4.8)
$145.2
$6.4
$151.6
FY2022A
Total
$175.9
($11.2)
$164.8
$0.2
$164.9
($0.8)
$164.1
$1.6
$165.7
Total Revenue as Reported
Less: #1 Customer LTE Transition B
Total Revenue (w Non-Core)
Less: Constant Currency Adjustment
Total Revenue (w Non-Core & CC Adj.)
Add: BMP Proforma E
Total Organic Revenue
IoT Solutions
FY2020A
Total
$55.1
$0.0
$55.1
($0.4)
$54.7
$19.1
$73.7
FY2021A
Total
$79.4
($23.6)
$55.8
($1.5)
$54.4
$23.3
$77.7
FY2022A
Total
$92.5
($11.5)
$81.0
($0.0)
$81.0
$4.1
$85.1
Organic Revenue Adjustments
Includes acquired customers that have left over time due to technology sunsetting over the last 3 years
Reflects the removal of significant one-time revenue in 2021 and 2022 for the company's largest customer's loT Solutions
revenue related to their LTE transition project
Maintained flat currency rates YoY
Adjustment to remove the effect of pricing difference between 2G/3G and 4G/5G by adjusting prior years to reflect 4G/5G
pricing
Reflects proforma impact of BMP normalized revenues from 2020 to Q1-22 (transaction close)
17View entire presentation