Presto SPAC Presentation Deck
Key Financial
Highlights
Source: Presto.
Note: This slide contains projected financial information with respect to
Presto. Such projected financial information constitutes forward-looking
information and is for illustrative purposes only and should not be relied upon
as necessarily being indicative of future results.
(1) Dollar-based net revenue retention rate is calculated by dividing the
current period's (Q1 '21) annual reoccurring revenue by the prior period's
(Q1 '20) annual reoccurring revenue from the same set of customers.
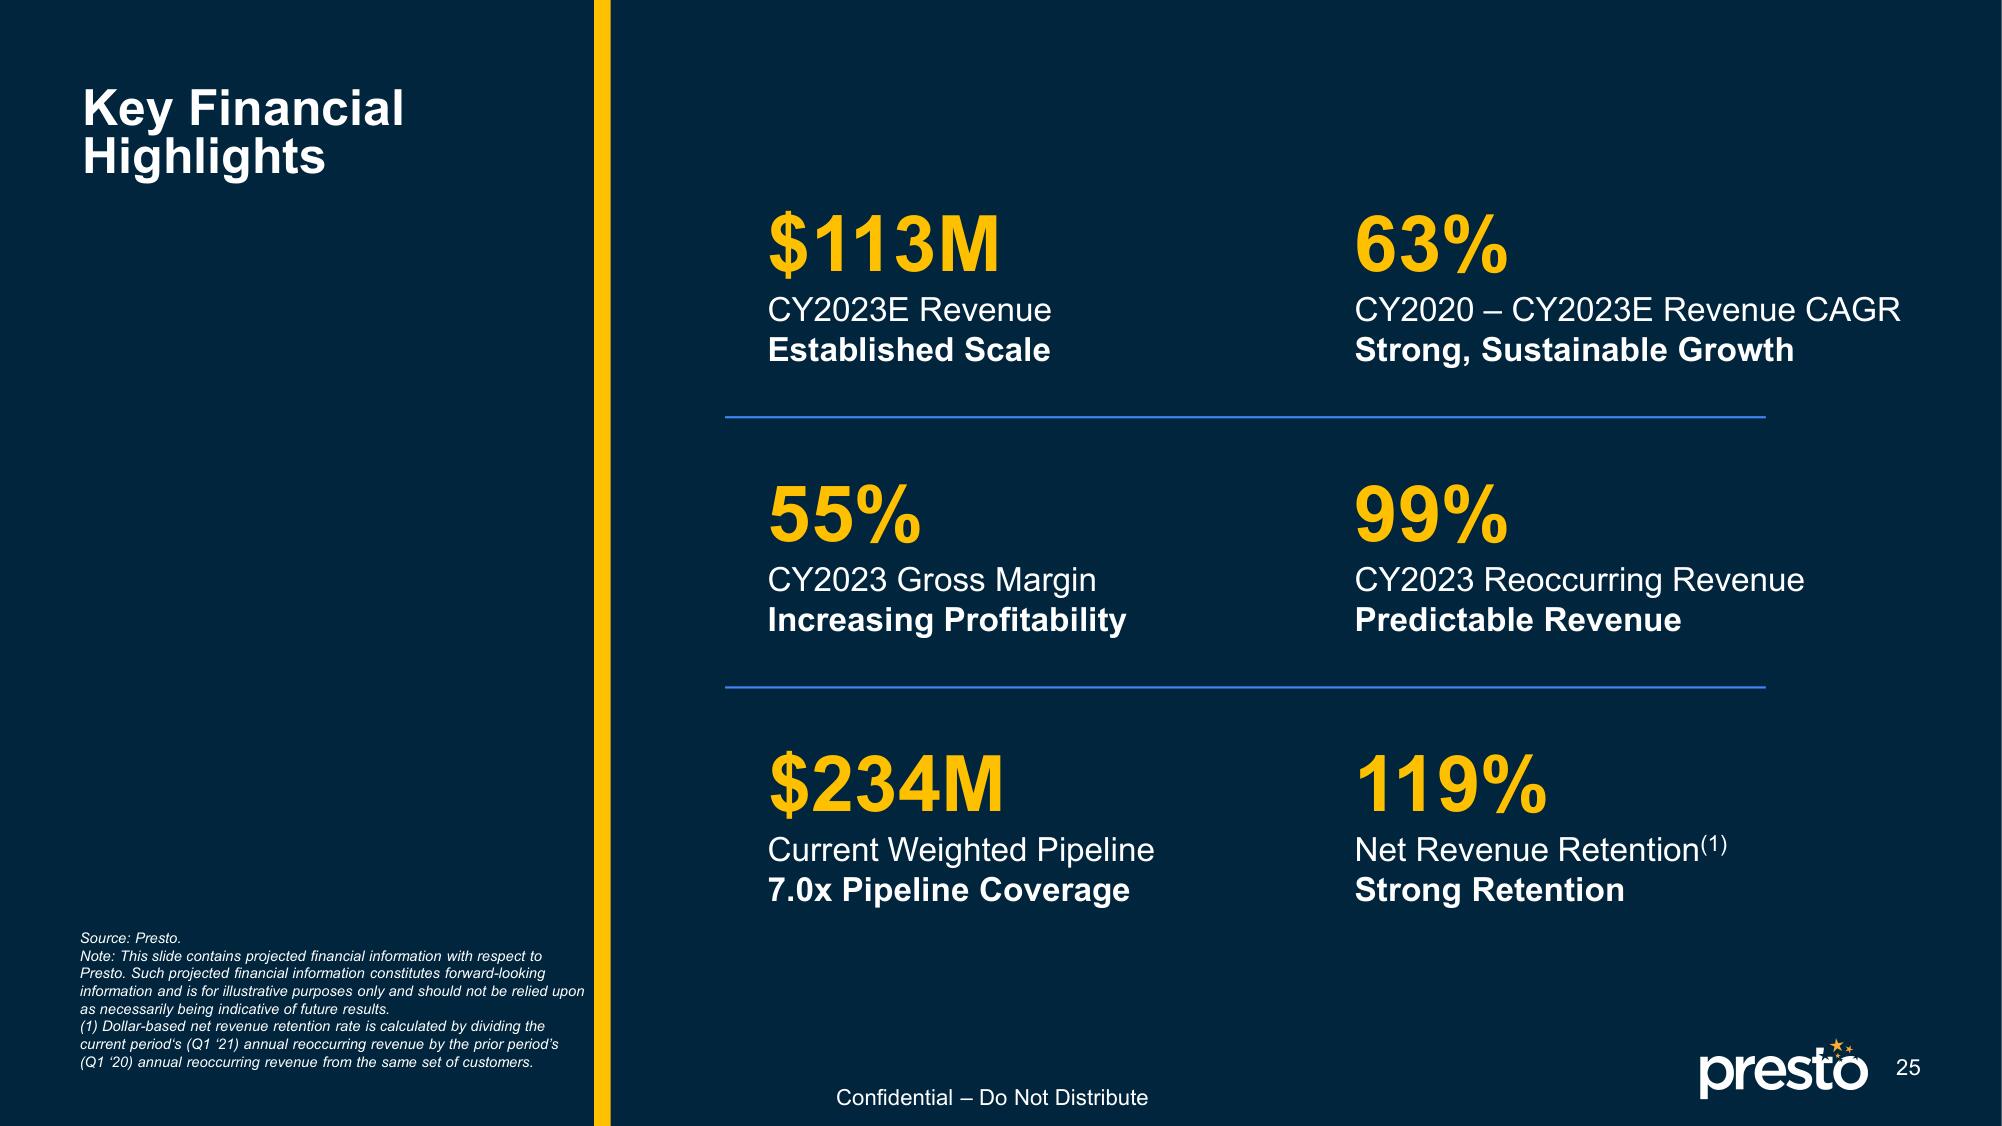
$113M
CY2023E Revenue
Established Scale
55%
CY2023 Gross Margin
Increasing Profitability
$234M
Current Weighted Pipeline
7.0x Pipeline Coverage
Confidential - Do Not Distribute
63%
CY2020 - CY2023E Revenue CAGR
Strong, Sustainable Growth
99%
CY2023 Reoccurring Revenue
Predictable Revenue
119%
Net Revenue Retention (1)
Strong Retention
presto
25View entire presentation