Twitter Results Presentation Deck
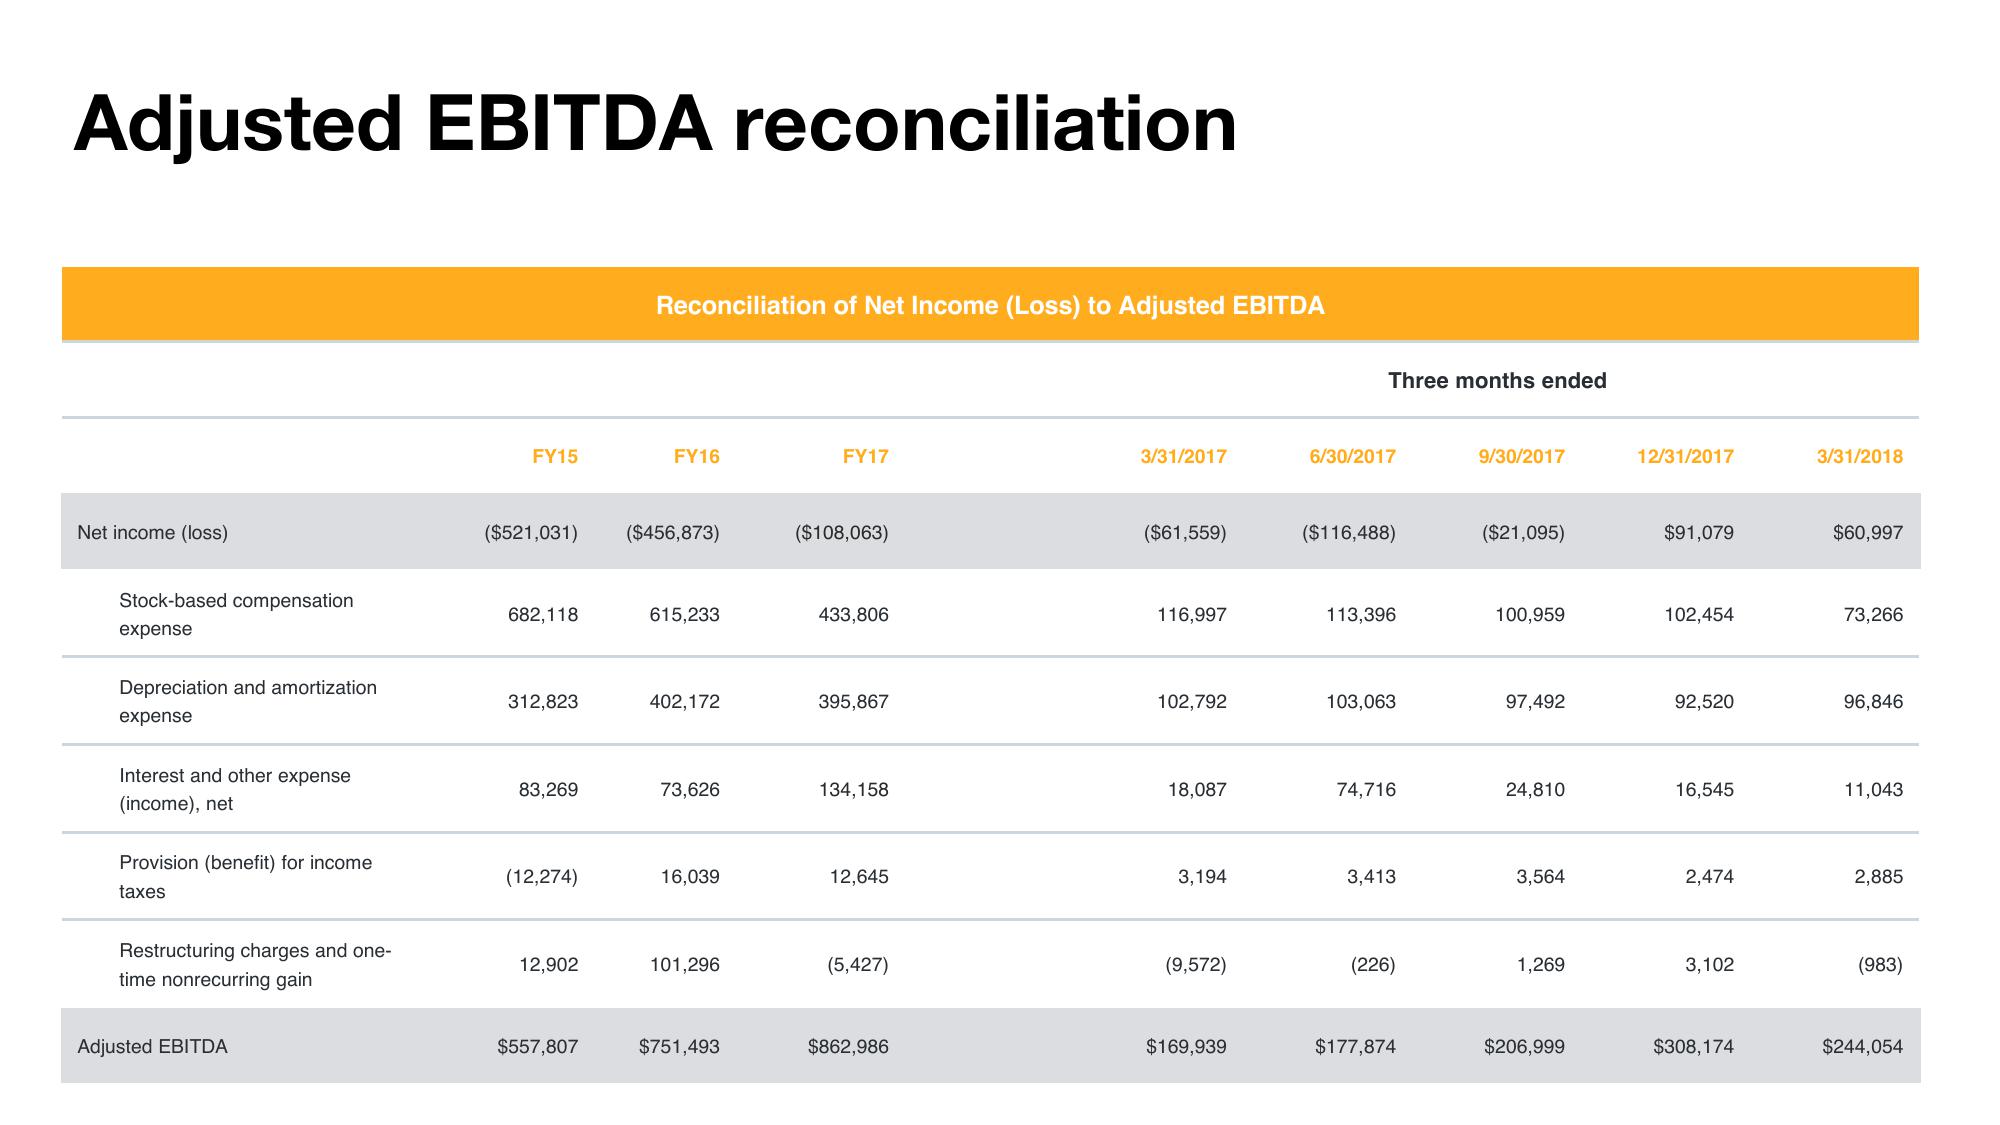
Adjusted EBITDA reconciliation
Net income (loss)
Stock-based compensation
expense
Depreciation and amortization
expense
Interest and other expense
(income), net
Provision (benefit) for income
taxes
Restructuring charges and one-
time nonrecurring gain
Adjusted EBITDA
FY15
682,118
($521,031) ($456,873)
312,823
83,269
(12,274)
12,902
Reconciliation of Net Income (Loss) to Adjusted EBITDA
$557,807
FY16
615,233
402,172
73,626
16,039
101,296
$751,493
FY17
($108,063)
433,806
395,867
134,158
12,645
(5,427)
$862,986
3/31/2017
($61,559)
116,997
102,792
18,087
3,194
(9,572)
$169,939
Three months ended
6/30/2017
($116,488)
113,396
103,063
74,716
3,413
(226)
$177,874
9/30/2017
($21,095)
100,959
97,492
24,810
3,564
1,269
$206,999
12/31/2017
$91,079
102,454
92,520
16,545
2,474
3,102
$308,174
3/31/2018
$60,997
73,266
96,846
11,043
2,885
(983)
$244,054View entire presentation