Ashtead Group Results Presentation Deck
US CONSTRUCTION OUTLOOK
300
250
200
150
100
50
2005
2007
2009
2011
Source: Dodge Data & Analytics (May 2022)
190
170
150
130
110
90
70
Dodge construction starts
Indexed: 2000-100
50
2013
2002 2004 2006 2008
Source: Dodge Data & Analytics (June 2022)
17 Full year results ¦ 30 April 2022
2015
2010
سر
2017
Dodge momentum index
Indexed: 2000=100, seasonally adjusted
2012
2019
2014
2021
2016
2023
начим
2018
2025
2020
2022
2019
Construction put in place ($bn)
Non-residential
■
2020
2021 2022
Non-building
Construction (excl. resi)
Residential
Construction (total)
Construction growth
Rental market ($bn)
Rental¹
51
46
50
Rental growth
+6%
-9%
+9%
Source: Dodge Data & Analytics (March 2022) / IHS Markit (May 2022)
¹ Excluding party and event
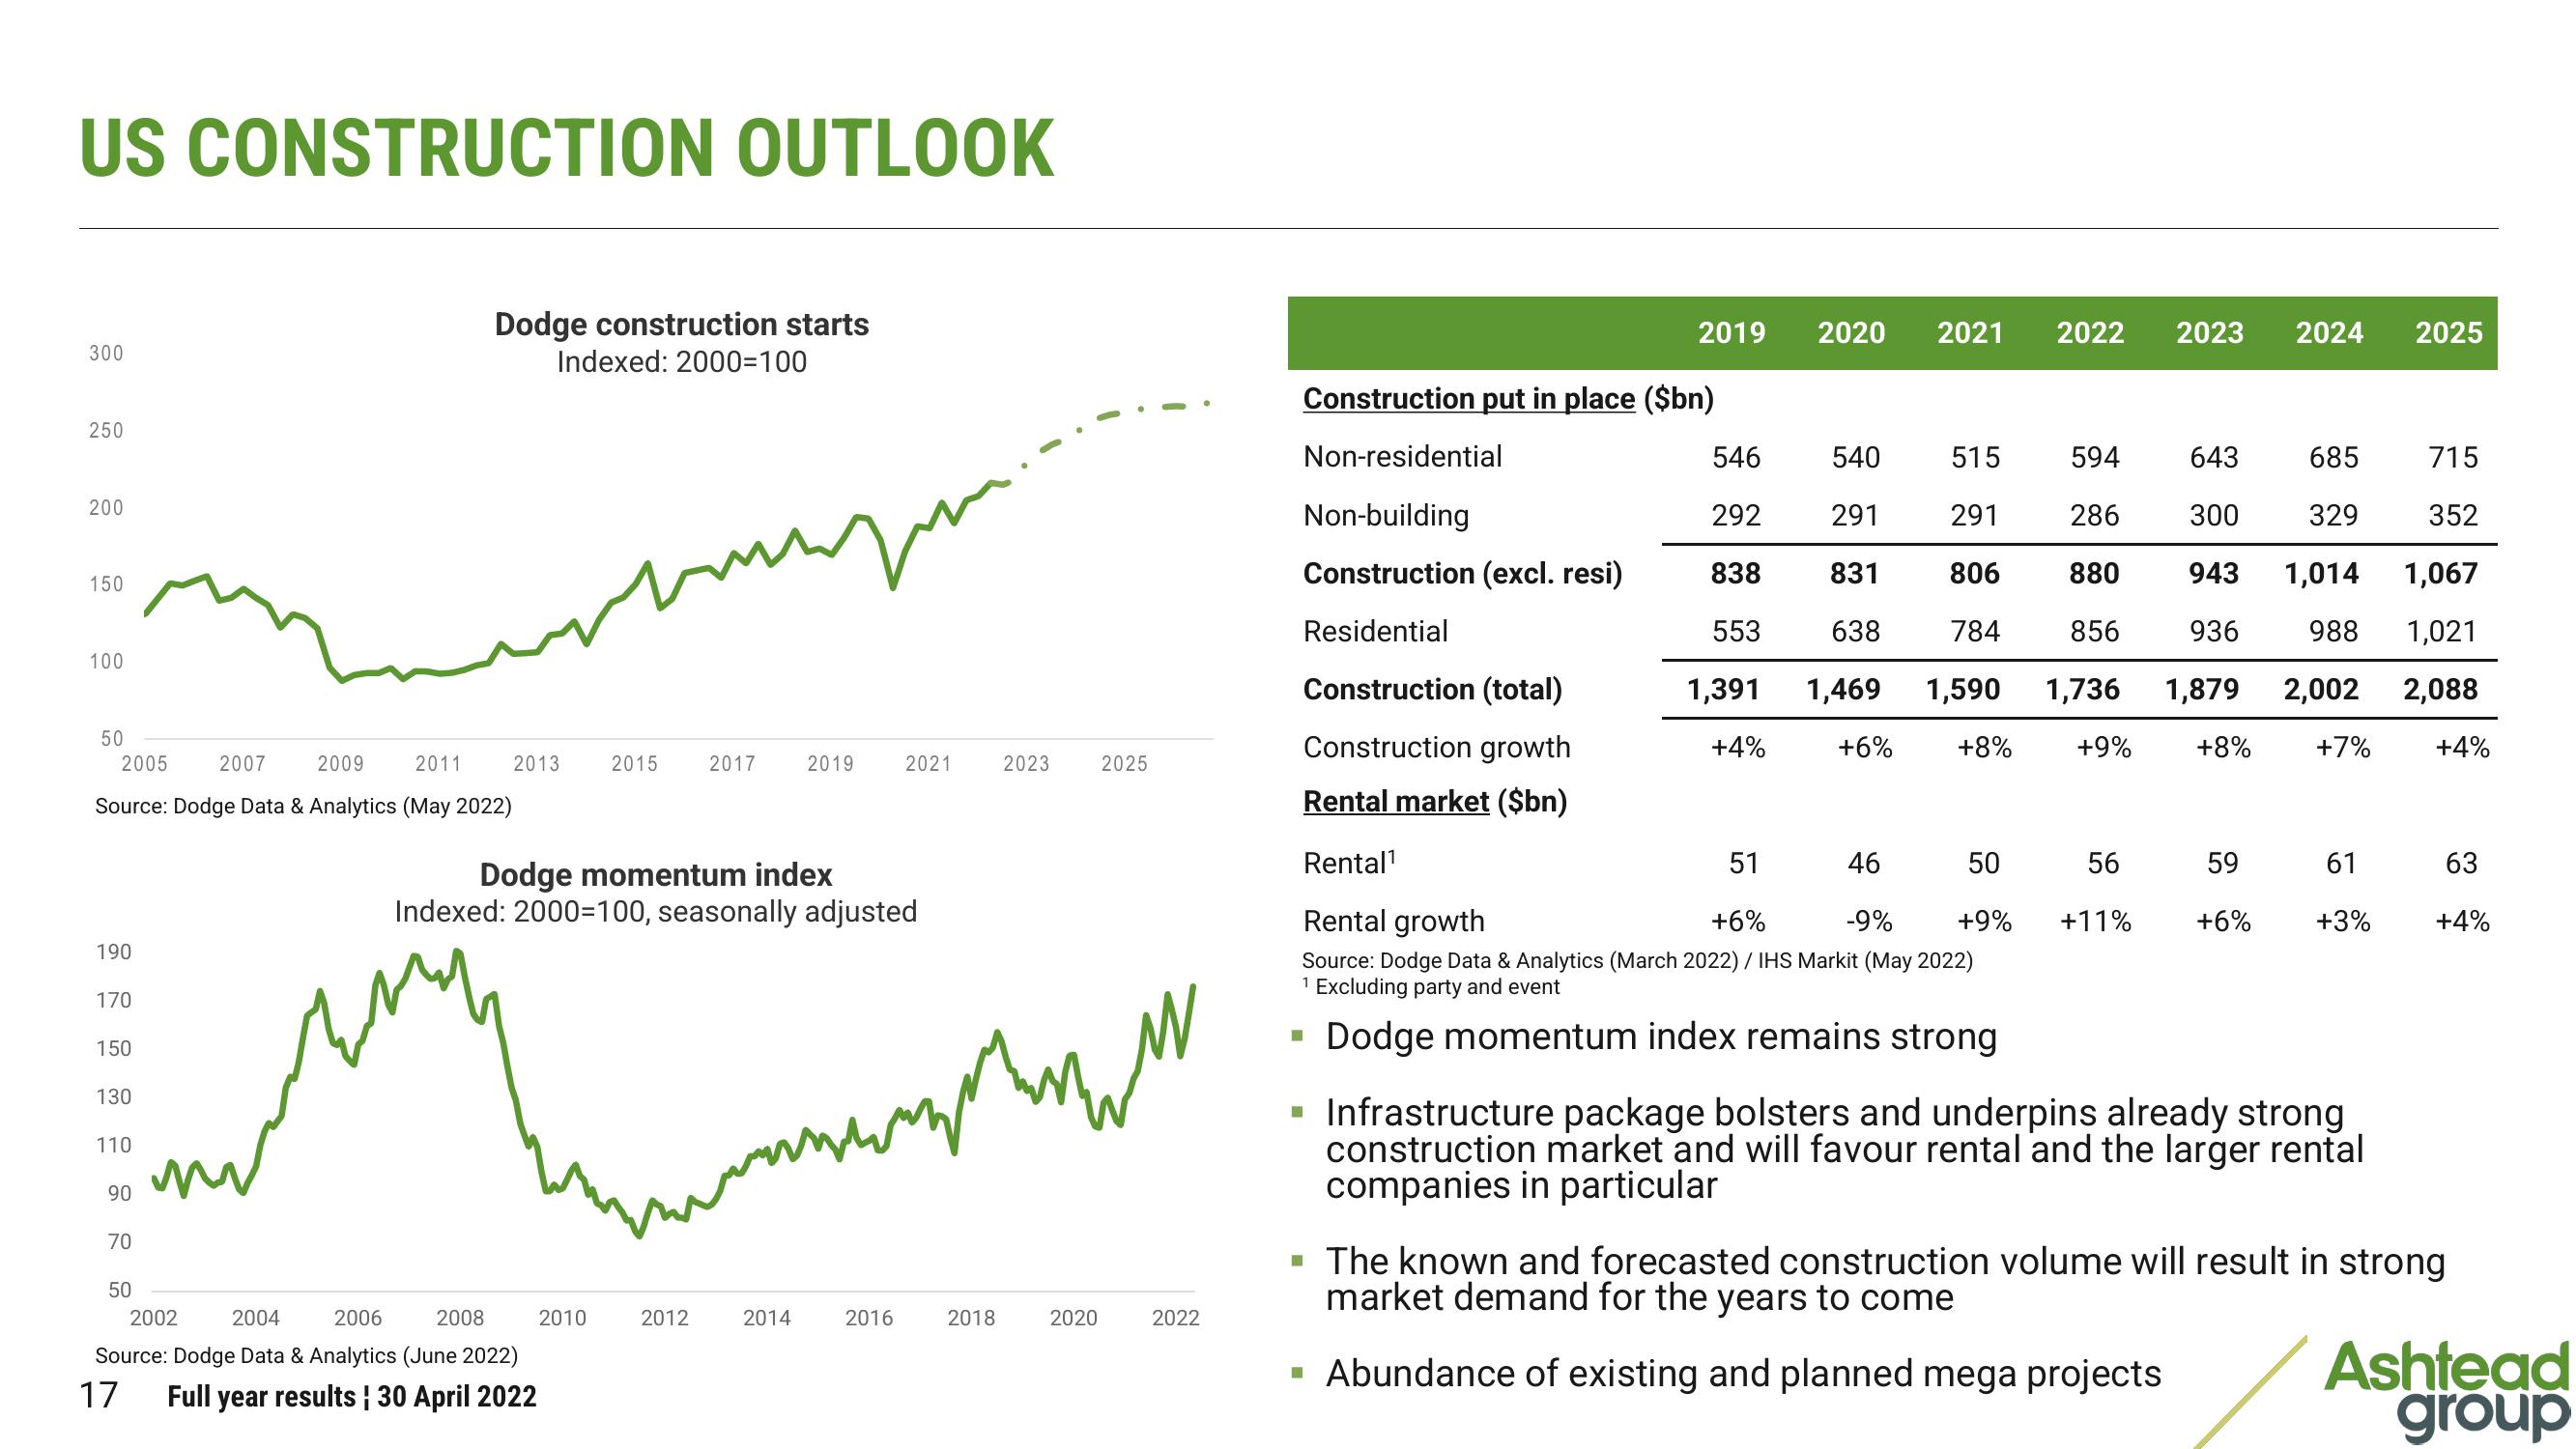
Dodge momentum index remains strong
2023 2024 2025
546
540
515
594
643
685
292
291
291
286
300
838
831
806
880
943
936
329
1,014
988
784
856
553 638
1,391 1,469 1,590 1,736 1,879 2,002
+4%
+6%
+8%
+9%
+8%
+7%
56
59
+11% +6%
61
+3%
▪ Infrastructure package bolsters and underpins already strong
construction market and will favour rental and the larger rental
companies in particular
715
352
1,067
1,021
2,088
+4%
63
+4%
▪ The known and forecasted construction volume will result in strong
market demand for the years to come
▪ Abundance of existing and planned mega projects
Ashtead
groupView entire presentation