AstraZeneca Investor Day Presentation Deck
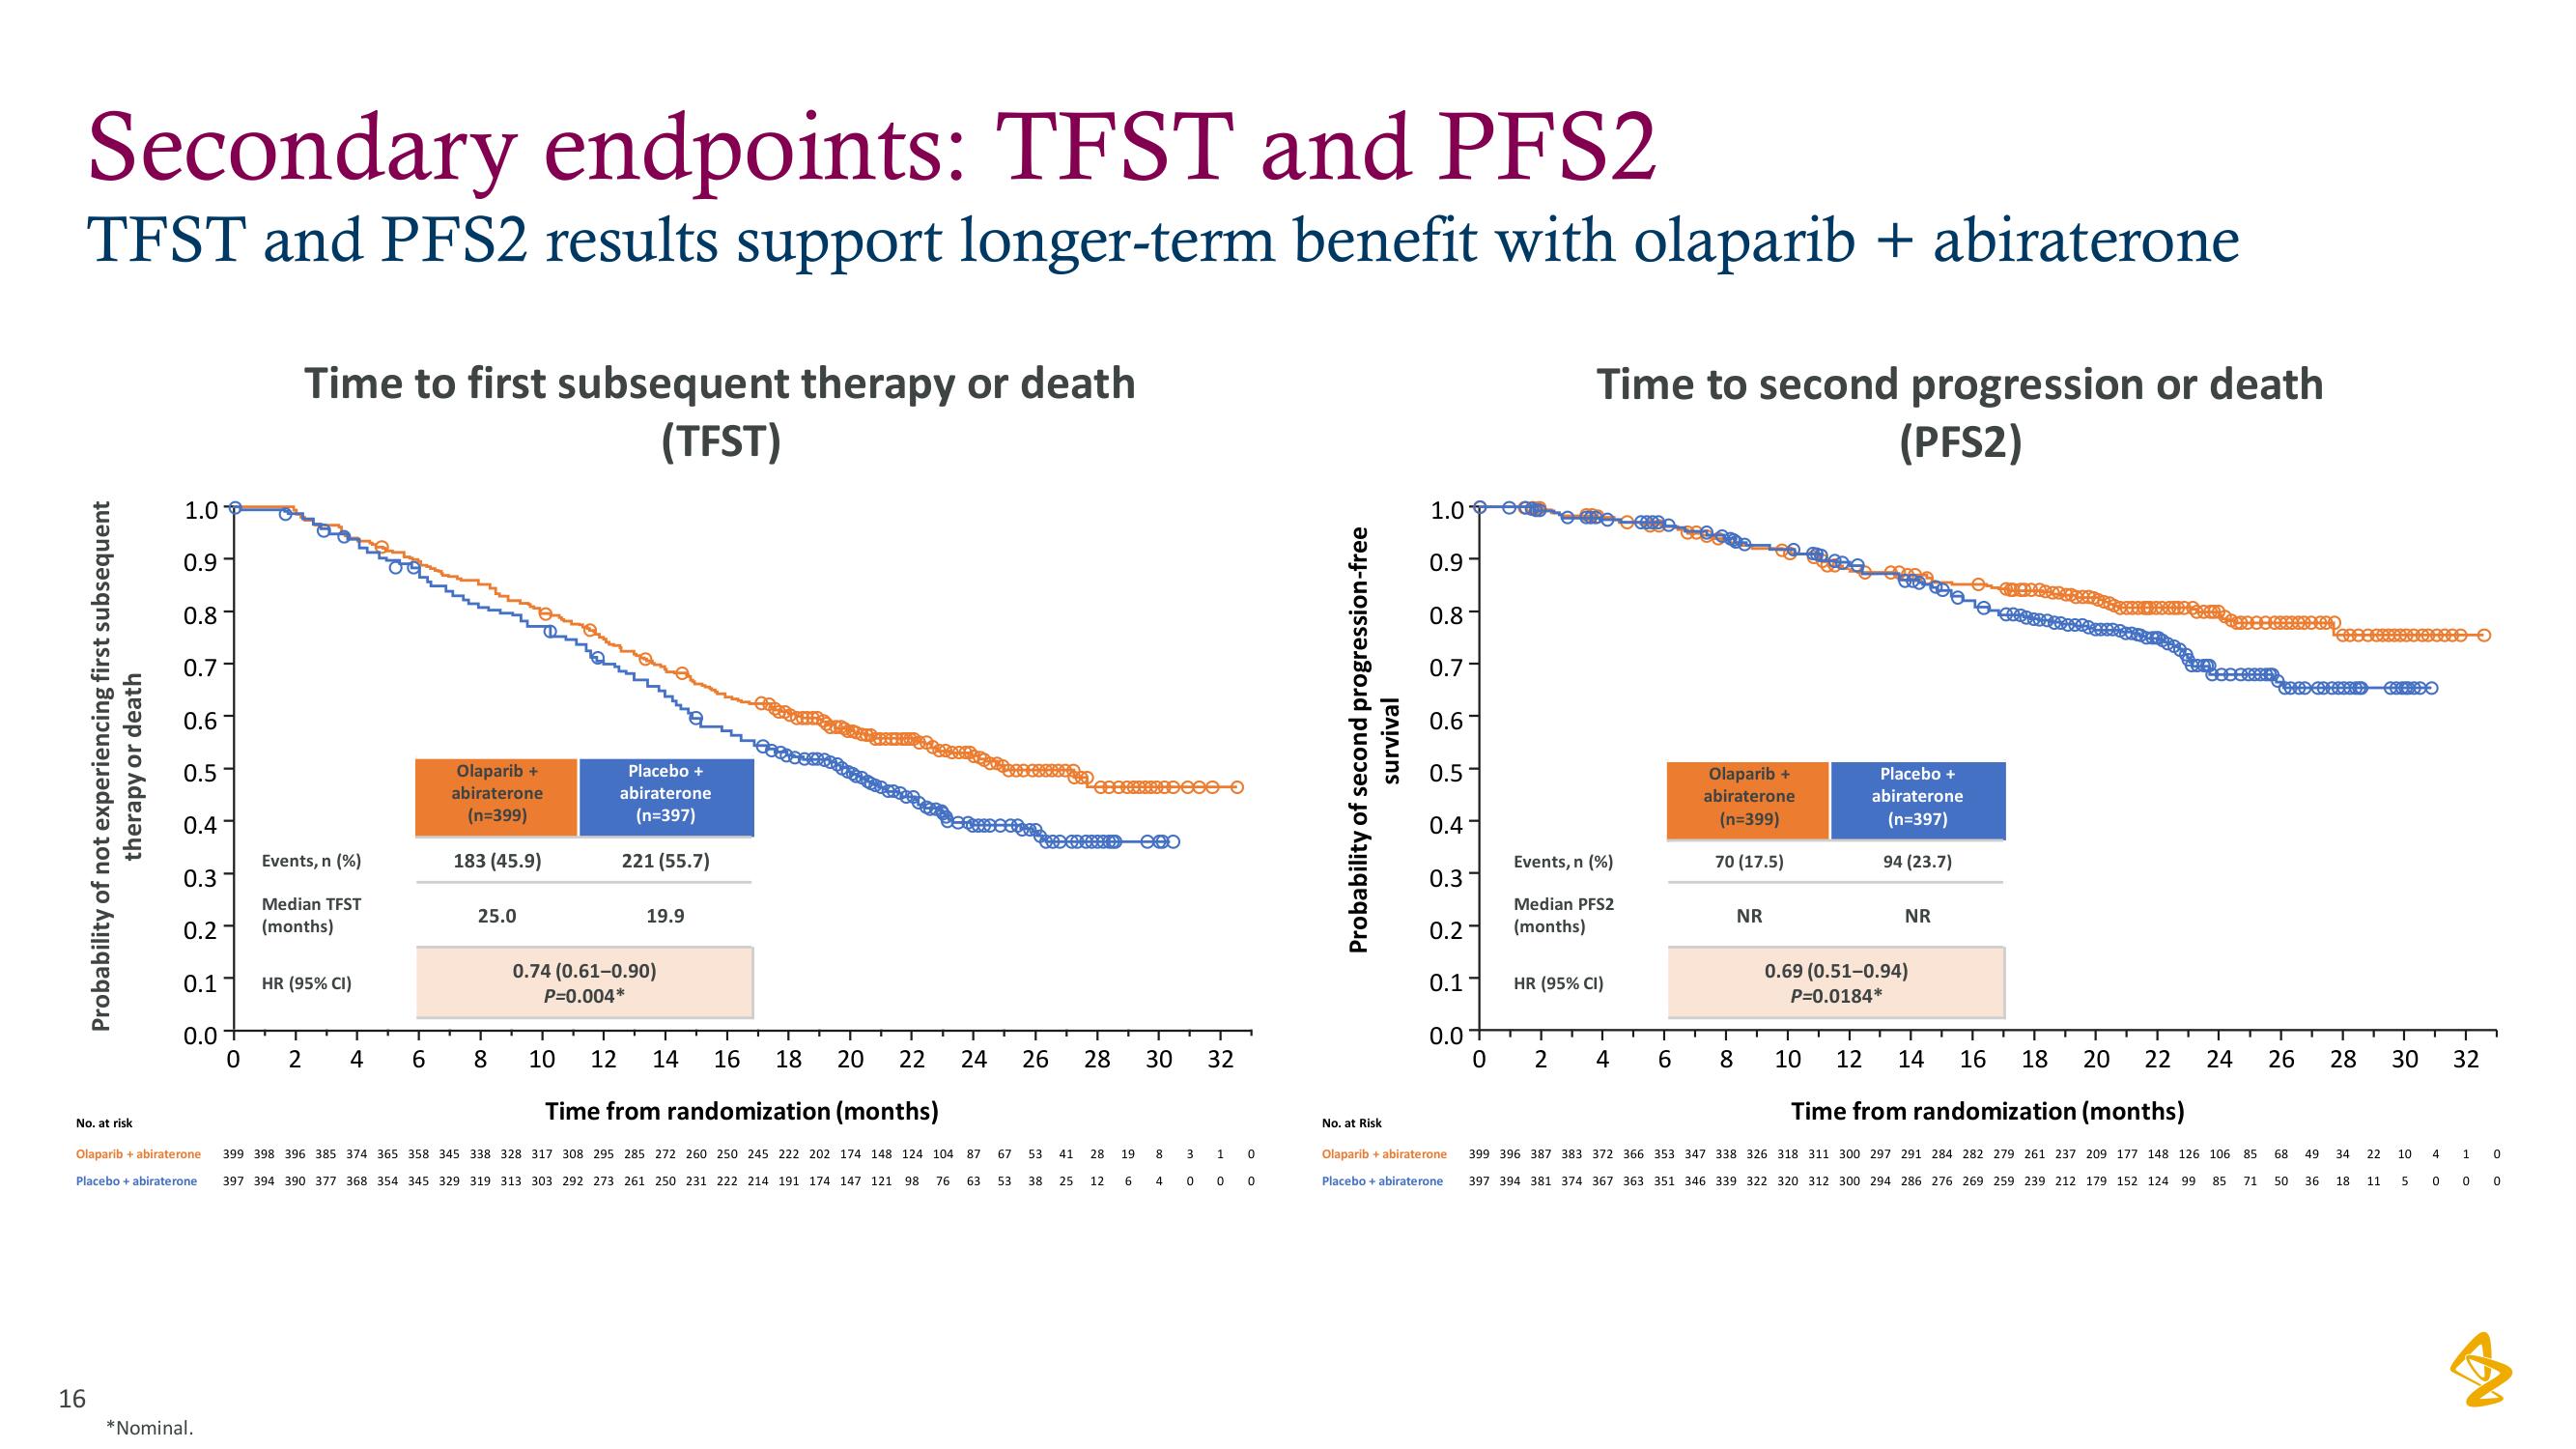
Secondary endpoints: TFST and PFS2
TFST and PFS2 results support longer-term benefit with olaparib + abiraterone
Probability of not experiencing first subsequent
therapy or death
No. at risk
16
1.0
0.9
0.8
0.7
0.6
0.5
0.4
0.1
0.3
0.2 (months)
0.0 +
0
Olaparib + abiraterone
Placebo + abiraterone
Time to first subsequent therapy or death
(TFST)
*Nominal.
Events, n (%)
Median TFST
HR (95% CI)
2 4
Olaparib +
abiraterone
(n=399)
183 (45.9)
6
25.0
Placebo +
abiraterone
(n=397)
221 (55.7)
8
10 12 14 16
Time from randomization (months)
53
399 398 396 385 374 365 358 345 338 328 317 308 295 285 272 260 250 245 222 202 174 148 124 104 87 67
397 394 390 377 368 354 345 329 319 313 303 292 273 261 250 231 222 214 191 174 147 121 98 76 63 53 38
19.9
0.74 (0.61-0.90)
P=0.004*
18
20
22
24
26
41
28
28
25 12
19
6
eo
30
8
4
3
0
32
1
0
0
0
Probability of second progression-free
survival
No. at Risk
1.0
0.9-
0.8-
0.71
0.6
0.5
0.4
0.3
0.21
0.1
0.0
Olaparib + abiraterone.
Placebo + abiraterone
0
Time to second progression or death
(PFS2)
Events, n (%)
Median PFS2
(months)
HR (95% CI)
2
4
st
6
Olaparib +
abiraterone
(n=399)
70 (17.5)
8
NR
Placebo +
abiraterone
(n=397)
94 (23.7)
NR
0.69 (0.51-0.94)
P=0.0184*
T
T
10 12 14 16 18 20 22 24
26 28 30
Time from randomization (months)
399 396 387 383 372 366 353 347 338 326 318 311 300 297 291 284 282 279 261 237 209 177 148 126 106 85 68 49 34 22 10
397 394 381 374 367 363 351 346 339 322 320 312 300 294 286 276 269 259 239 212 179 152 124 99 85 71 50 36 18 11 5
888-O
4
0
32
1 0
0 0View entire presentation