Bed Bath & Beyond Results Presentation Deck
APPENDIX
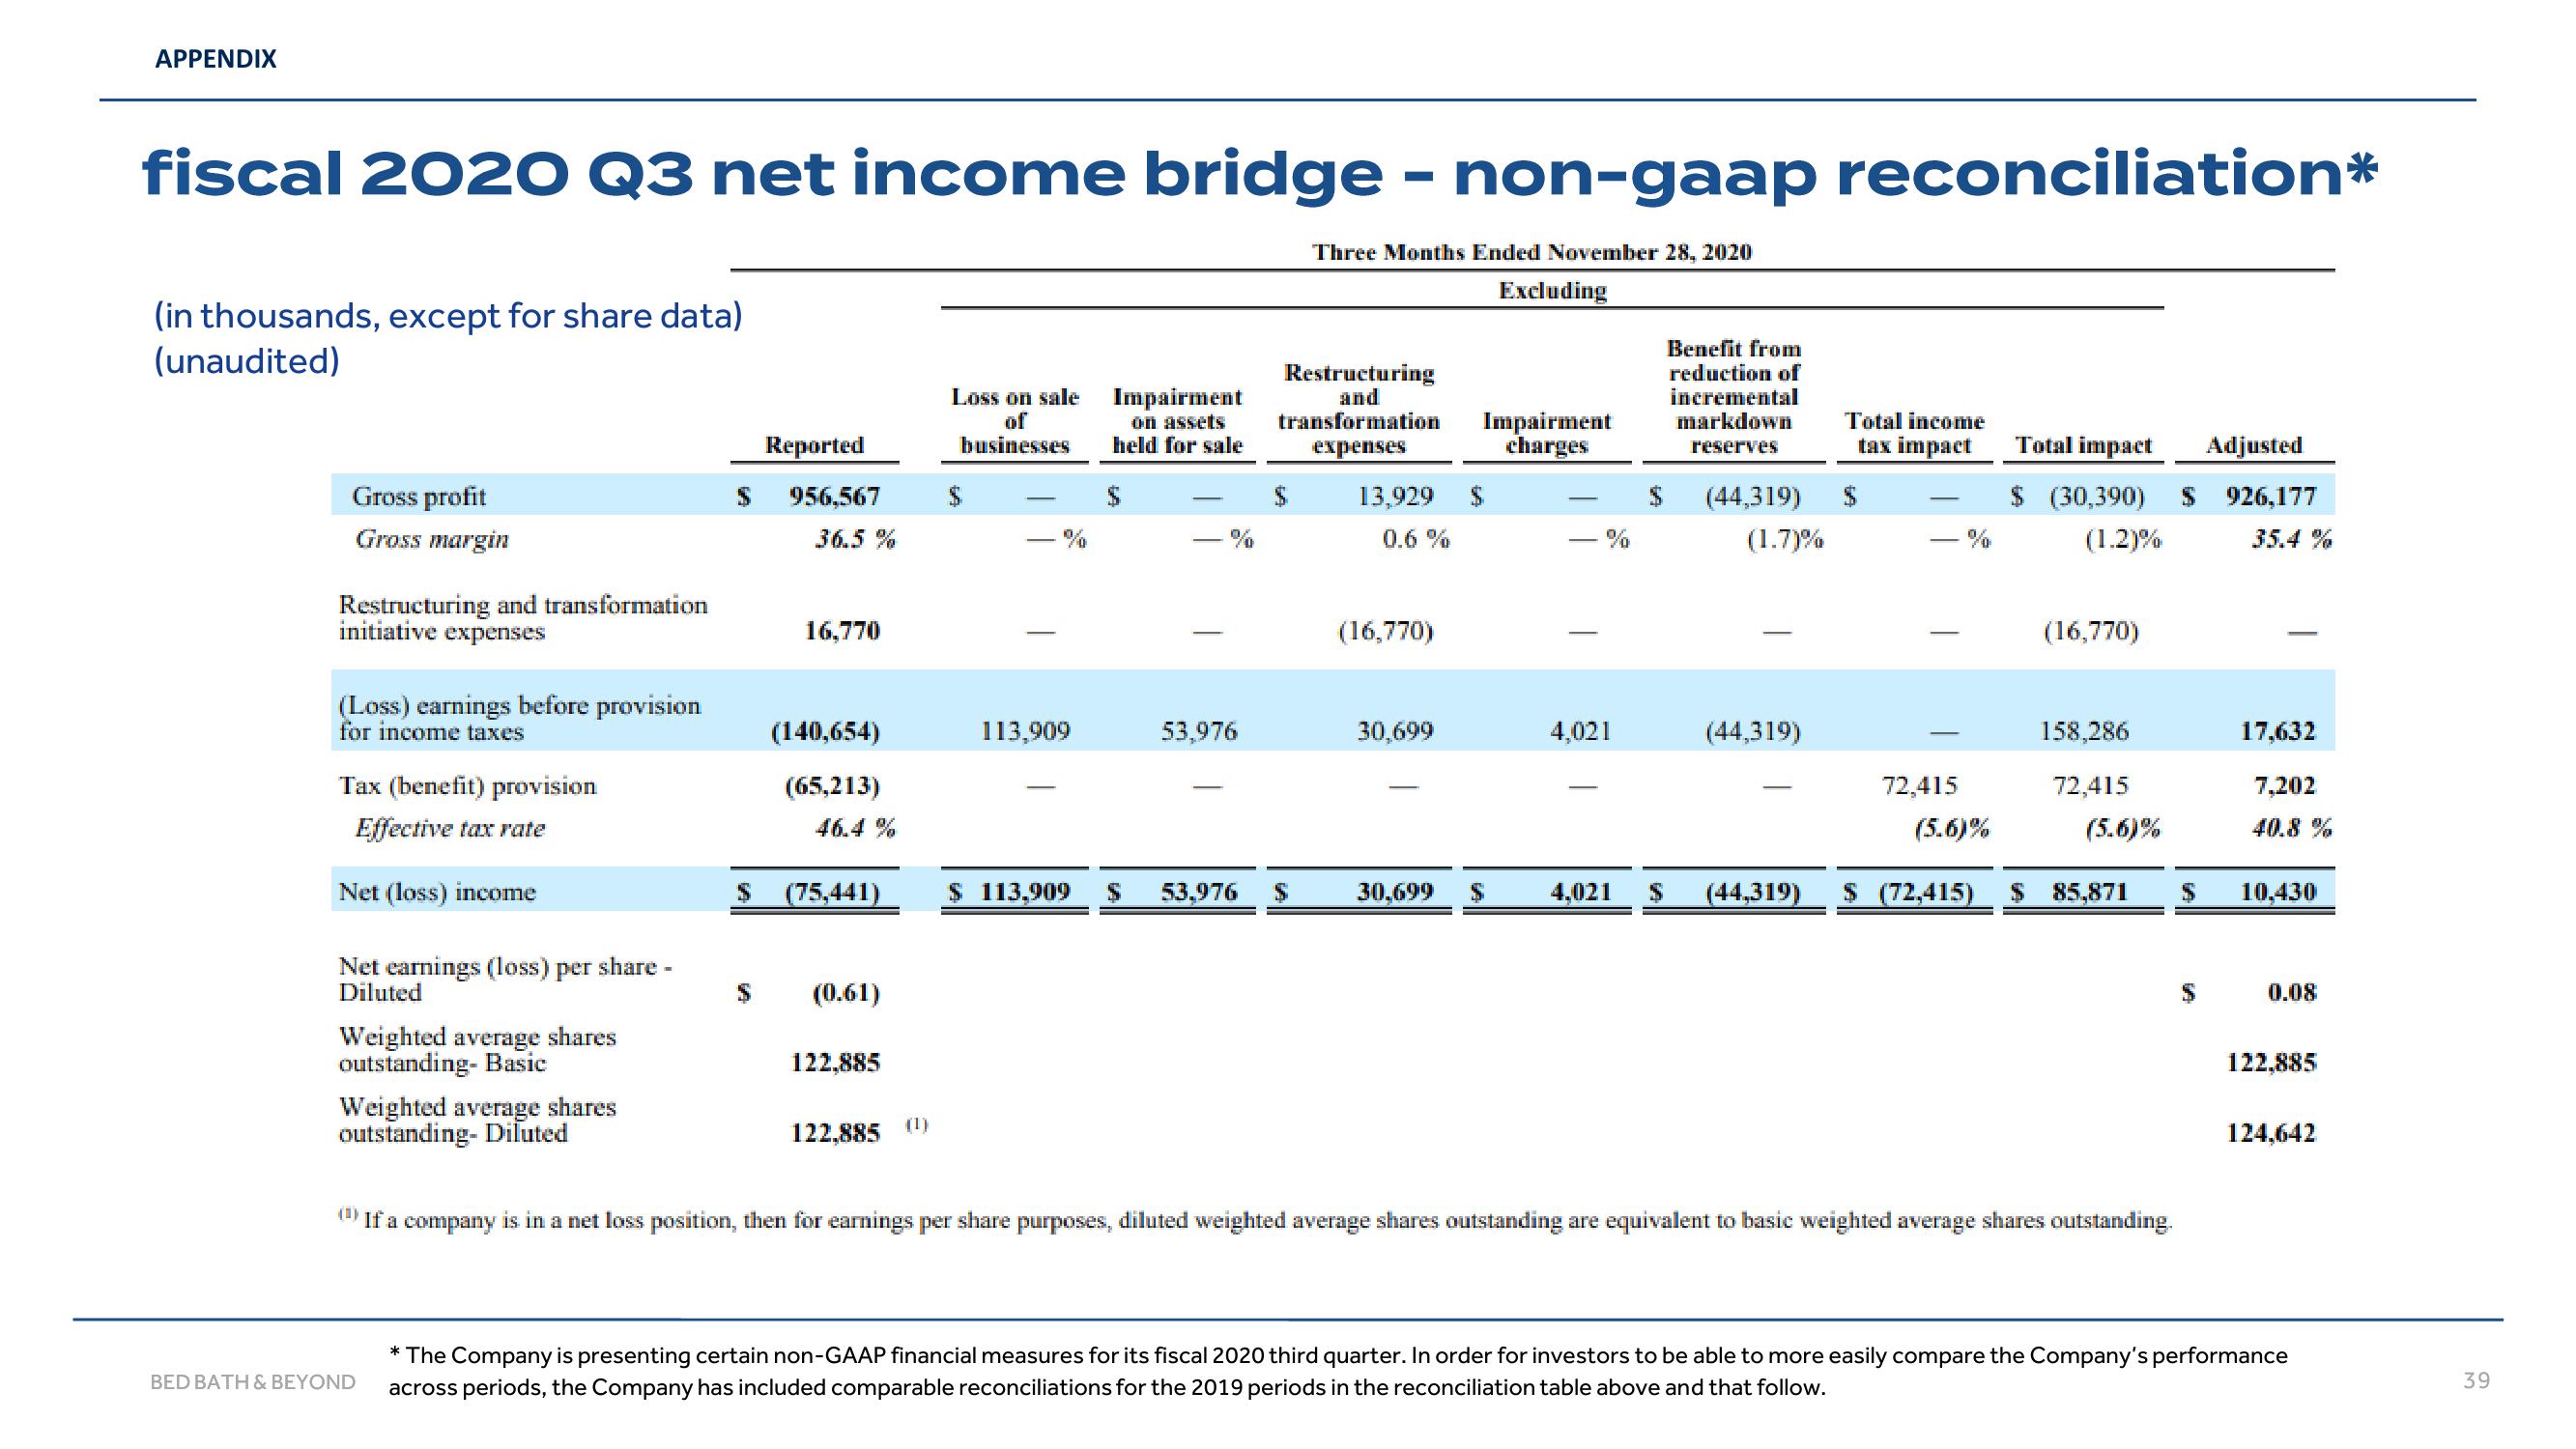
fiscal 2020 Q3 net income bridge - non-gaap reconciliation*
(in thousands, except for share data)
(unaudited)
Gross profit
Gross margin
Restructuring and transformation
initiative expenses
(Loss) earnings before provision
for income taxes
Tax (benefit) provision
Effective tax rate
Net (loss) income
Net earnings (loss) per share-
Diluted
Weighted average shares
outstanding- Basic
Weighted average shares
outstanding- Diluted
$
BED BATH & BEYOND
Reported
956,567
36.5%
16,770
(140,654)
(65,213)
46.4 %
(75,441)
(0.61)
122,885
122,885 (¹)
Loss on sale Impairment
of
businesses
113,909
on assets
held for sale
53,976
Three Months Ended November 28, 2020
$ 113,909 $ 53,976 $
Restructuring
and
transformation Impairment
expenses
charges
13,929
0.6 %
(16,770)
30,699
30,699
Excluding
$
4,021
Benefit from
reduction of
incremental
markdown
reserves
(44,319)
(1.7)%
(44,319)
Total income
tax impact
72,415
(5.6)%
Total impact
$ (30,390)
(1.2)%
(16,770)
158,286
72,415
(5.6)%
(¹) If a company is in a net loss position, then for earnings per share purposes, diluted weighted average shares outstanding are equivalent to basic weighted average shares outstanding.
Adjusted
$ 926,177
35.4 %
4,021 $ (44,319) $ (72,415) $ 85,871 $
S
17,632
7,202
40.8%
10,430
0.08
122,885
124.642
* The Company is presenting certain non-GAAP financial measures for its fiscal 2020 third quarter. In order for investors to be able to more easily compare the Company's performance
across periods, the Company has included comparable reconciliations for the 2019 periods in the reconciliation table above and that follow.
39View entire presentation