Booking Holdings Shareholder Engagement Presentation Deck
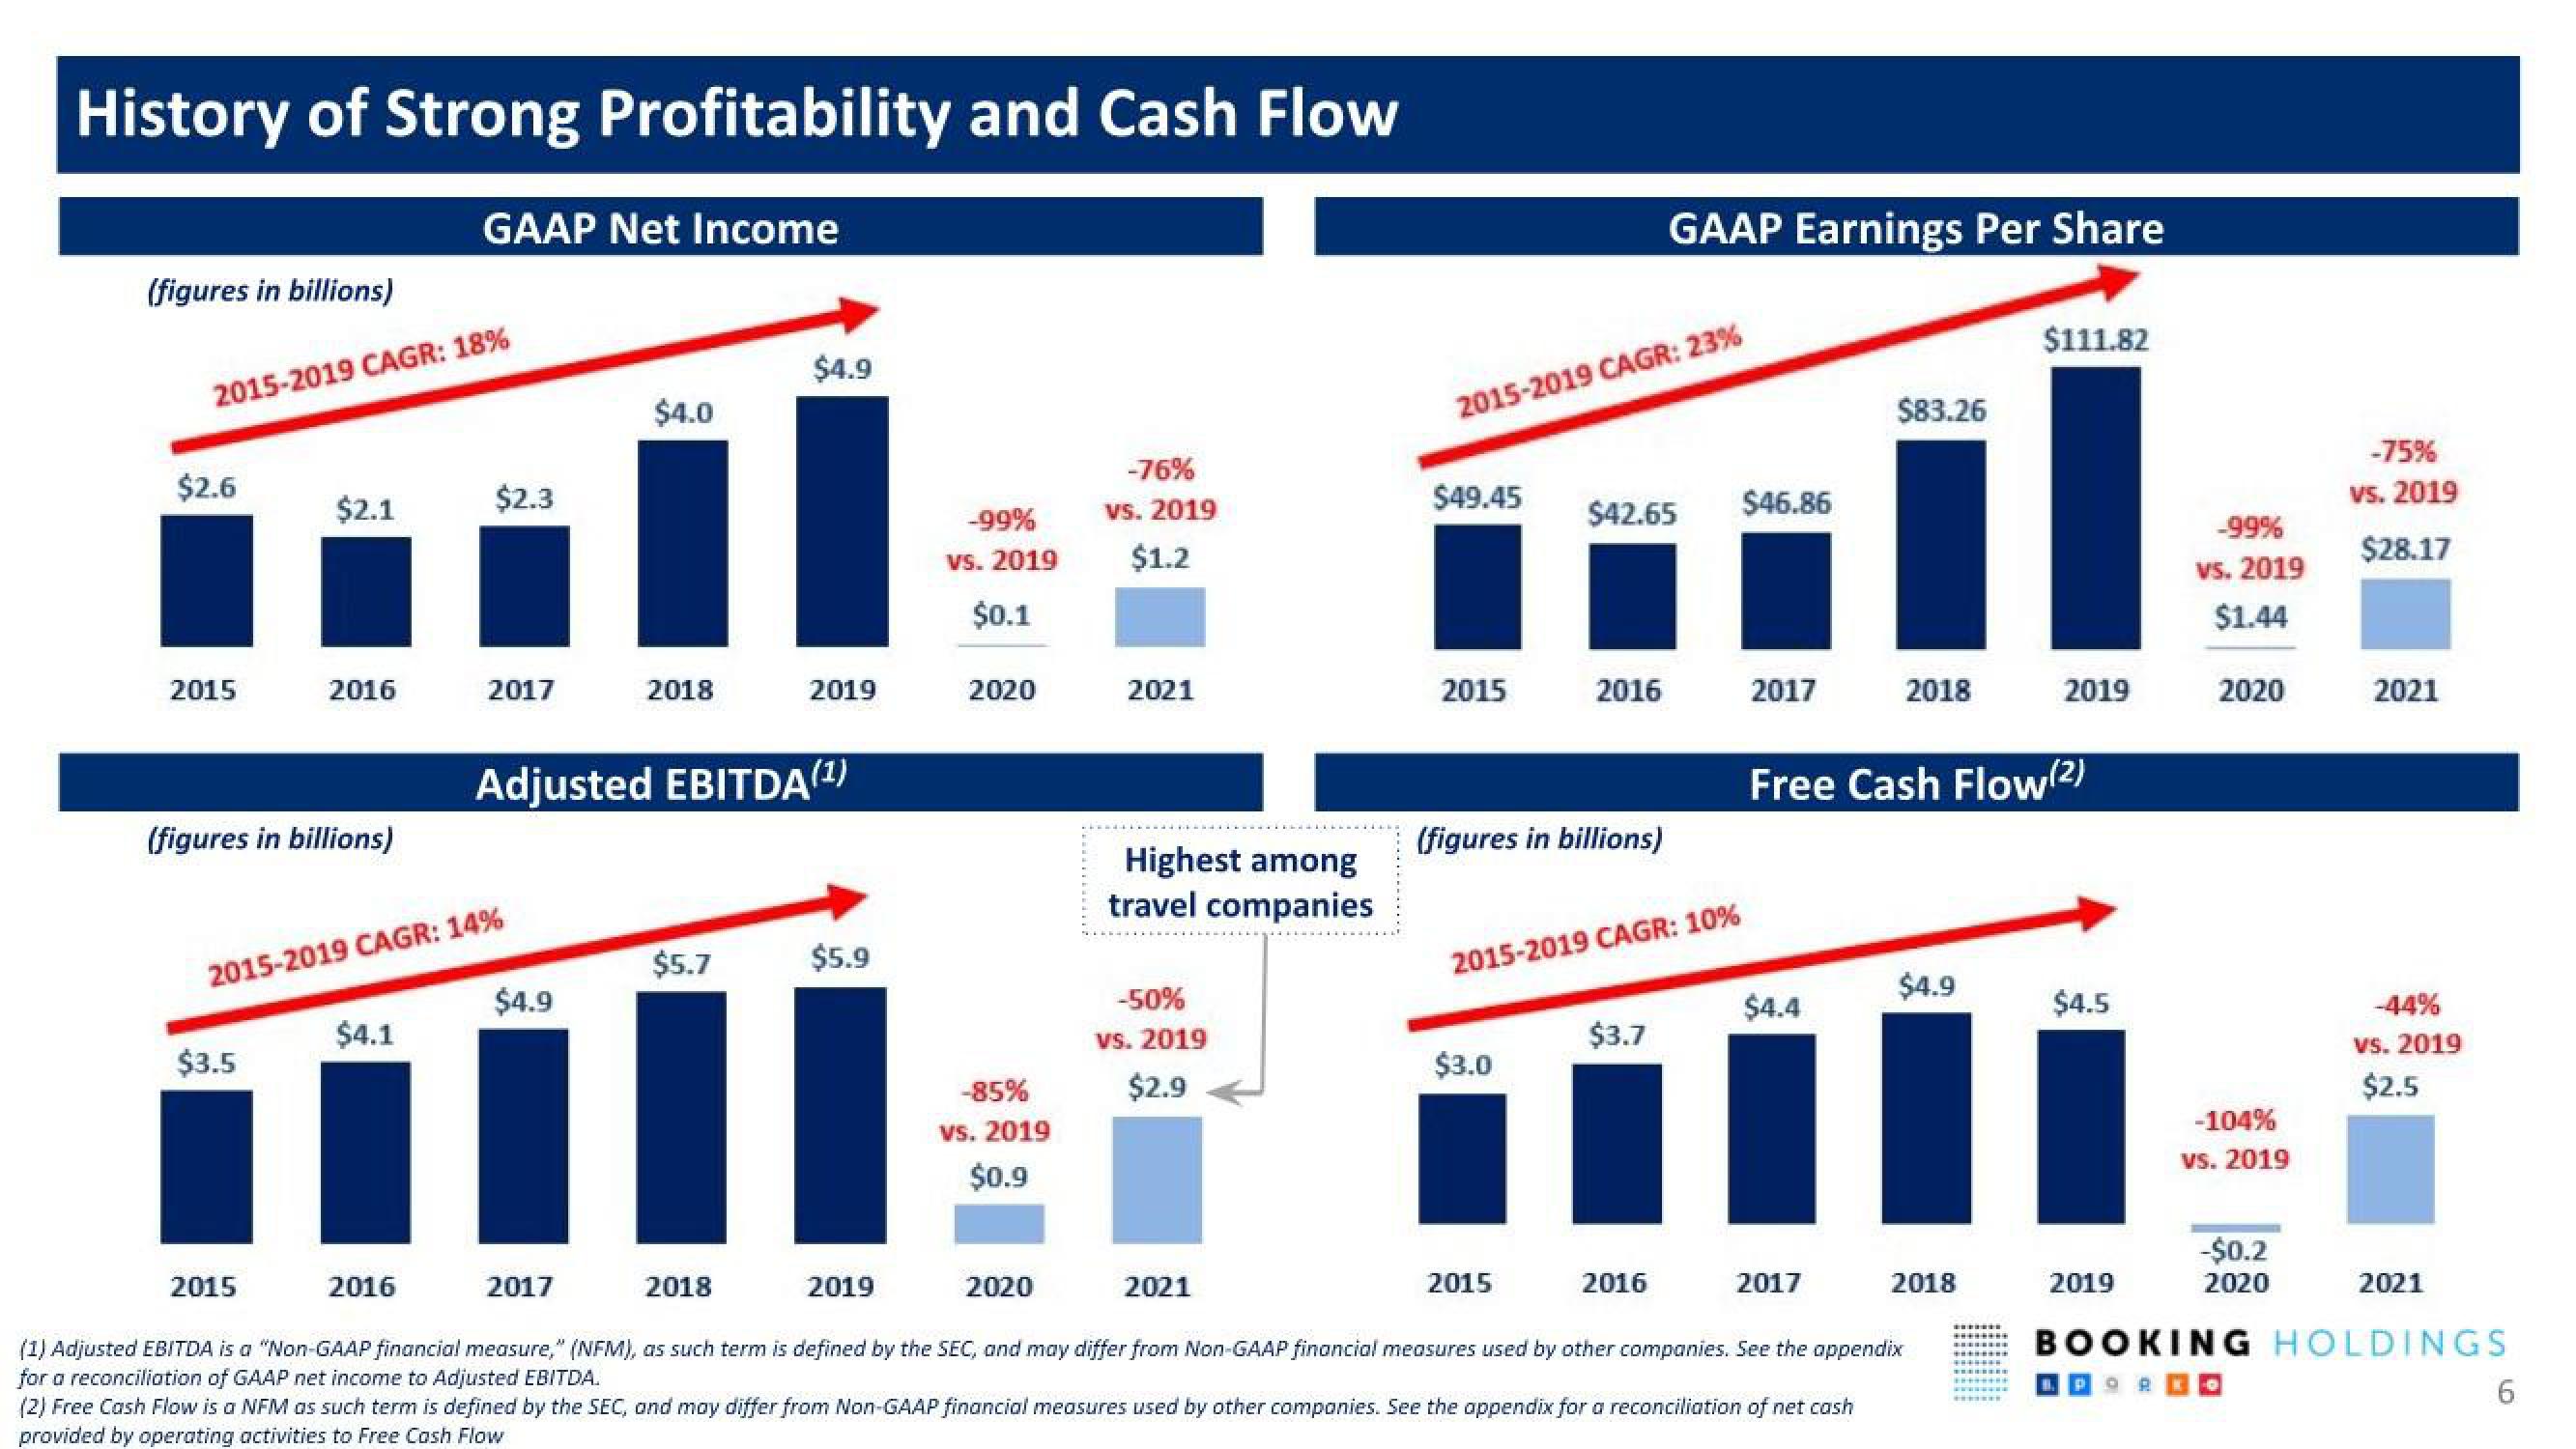
History of Strong Profitability and Cash Flow
(figures in billions)
2015-2019 CAGR: 18%
$2.6
2015
$2.1
(figures in billions)
$3.5
2016
2015
GAAP Net Income
$4.1
2015-2019 CAGR: 14%
$2.3
2016
2017
$4.0
$4.9
2018
Adjusted EBITDA(¹)
$4.9
$5.7
2019
$5.9
I
-99%
vs. 2019
$0.1
2020
-85%
vs. 2019
$0.9
-76%
vs. 2019
$1.2
2021
Highest among
travel companies
-50%
vs. 2019
$2.9
2015-2019 CAGR: 23%
$49.45
2015
(figures in billions)
$3.0
$42.65
2016
2015-2019 CAGR: 10%
2015
GAAP Earnings Per Share
$3.7
2016
$46.86
2017
2017
2018
2019
2020
2021
(1) Adjusted EBITDA is a "Non-GAAP financial measure," (NFM), as such term is defined by the SEC, and may differ from Non-GAAP financial measures used by other companies. See the appendix
for a reconciliation of GAAP net income to Adjusted EBITDA.
$4.4
$83.26
2017
Free Cash Flow(2)
(2) Free Cash Flow is a NFM as such term is defined by the SEC, and may differ from Non-GAAP financial measures used by other companies. See the appendix for a reconciliation of net cash
provided by operating activities to Free Cash Flow
2018
$4.9
$111.82
2018
2019
$4.5
2019
-99%
vs. 2019
$1.44
2020
-104%
vs. 2019
-$0.2
2020
-75%
vs. 2019
$28.17
2021
-44%
vs. 2019
$2.5
2021
BOOKING HOLDINGS
6View entire presentation