First Merchants Investor Presentation Deck
■
Investment Portfolio Highlights
■
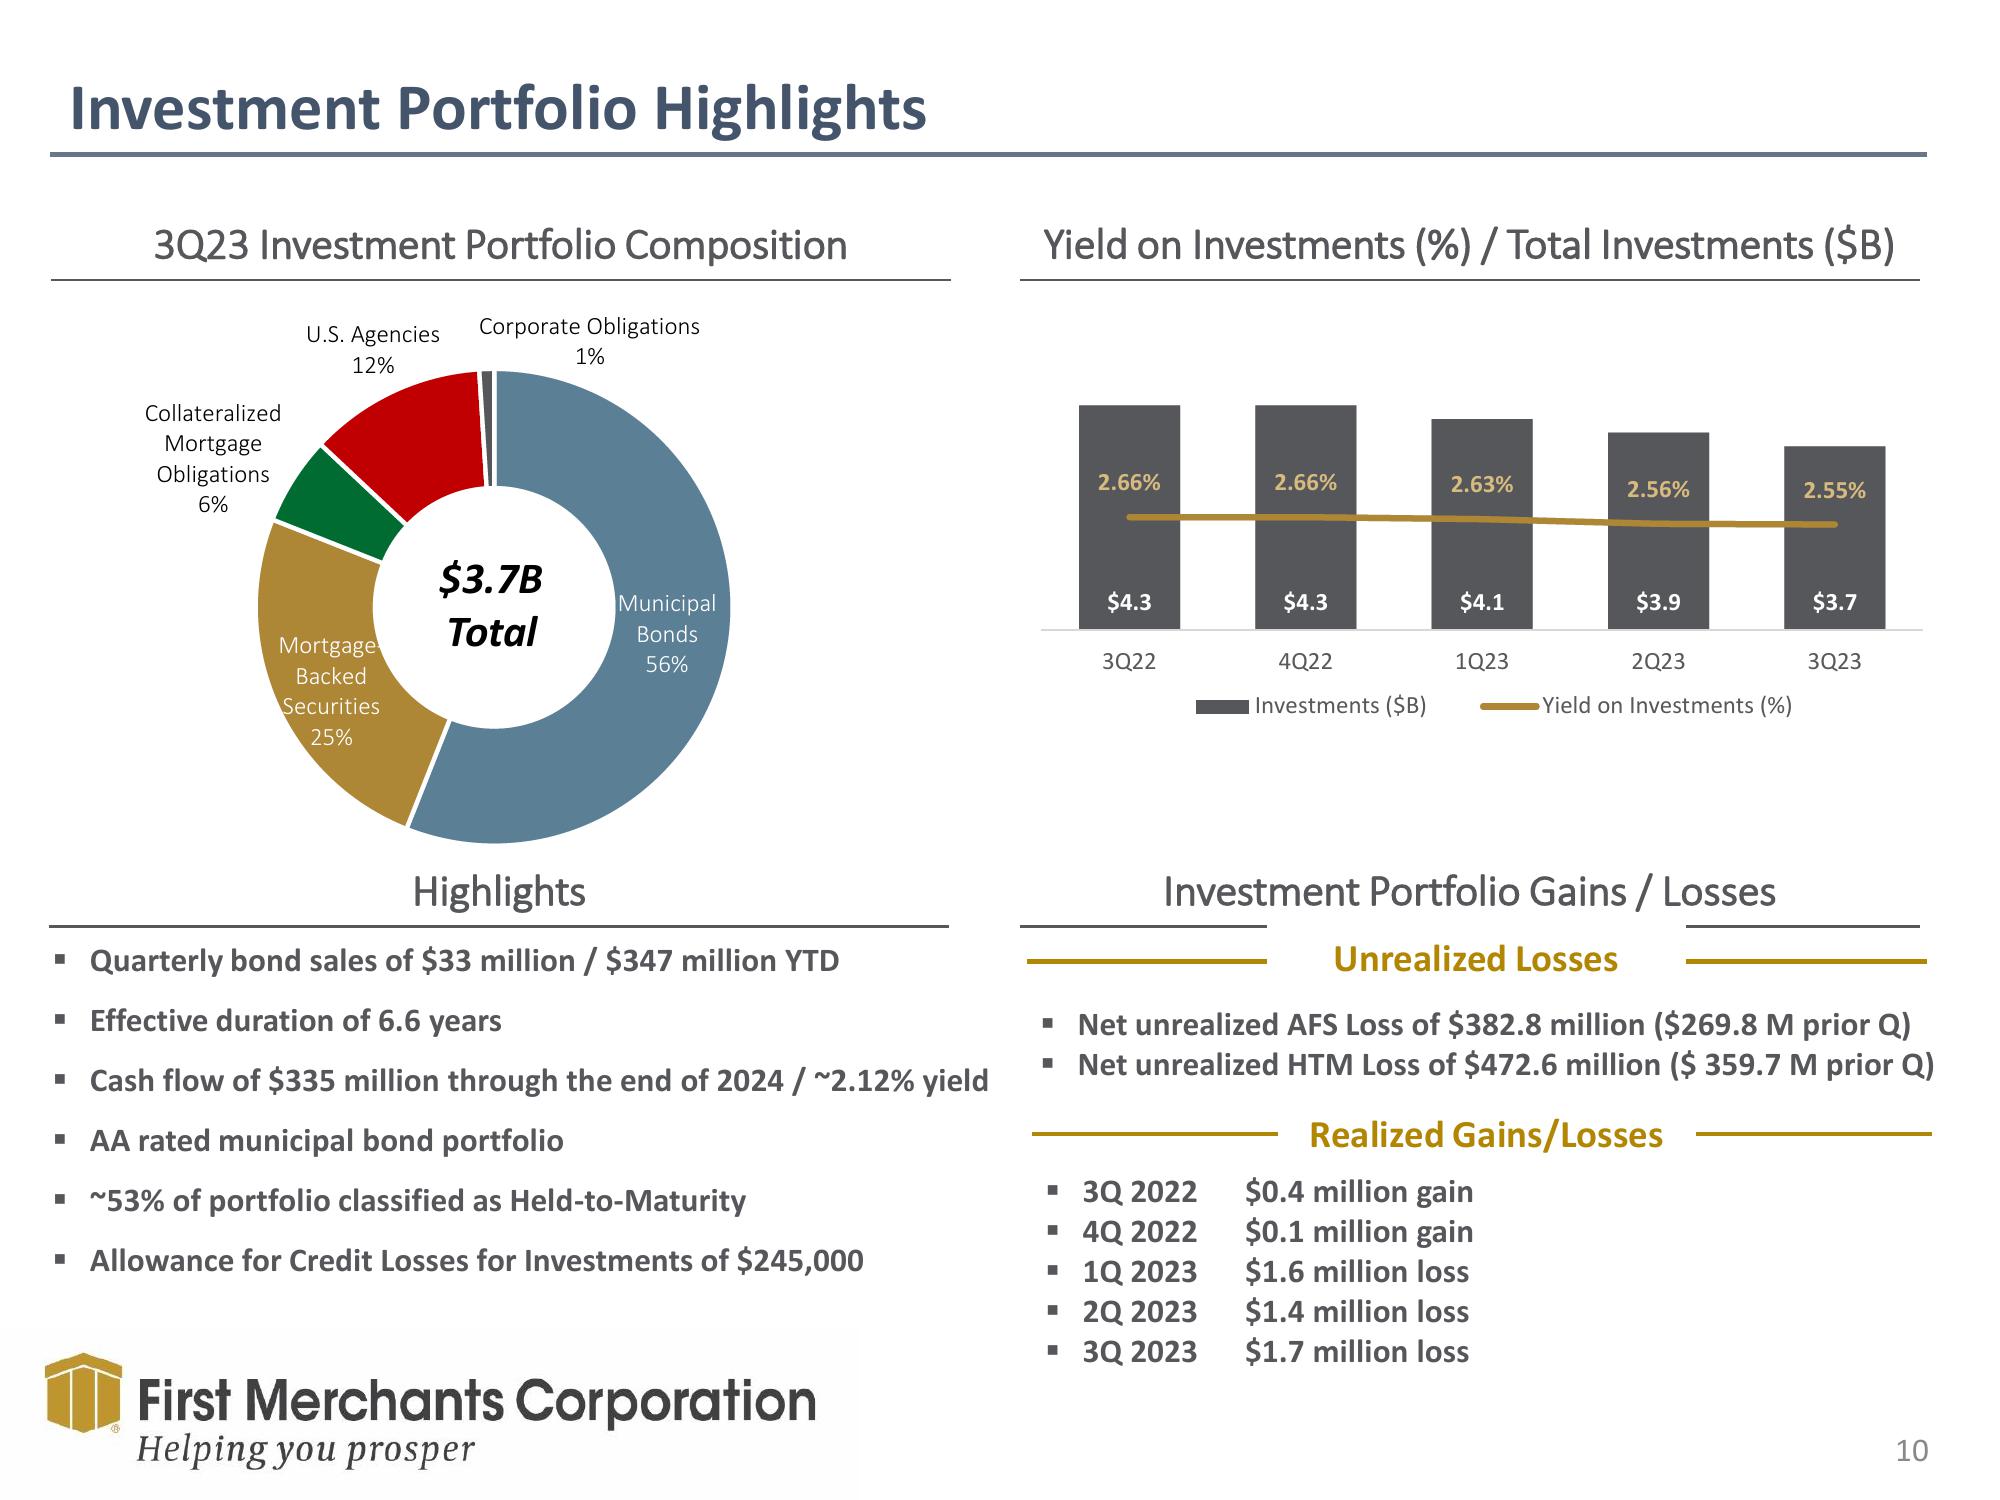
3Q23 Investment Portfolio Composition
U.S. Agencies Corporate Obligations
12%
Collateralized
Mortgage
Obligations
6%
Mortgage
Backed
Securities
25%
$3.7B
Total
1%
Highlights
▪ Quarterly bond sales of $33 million / $347 million YTD
Effective duration of 6.6 years
Cash flow of $335 million through the end of 2024 /~2.12% yield
▪ AA rated municipal bond portfolio
▪ ~53% of portfolio classified as Held-to-Maturity
■ Allowance for Credit Losses for Investments of $245,000
Municipal
Bonds
56%
First Merchants Corporation
Helping you prosper
Yield on Investments (%) / Total Investments ($B)
2.66%
$4.3
3Q22
2.66%
▪ 3Q 2022
▪ 4Q 2022
▪ 1Q 2023
▪ 2Q 2023
▪ 3Q 2023
$4.3
4Q22
Investments ($B)
2.63%
$4.1
1Q23
2.56%
$3.9
$0.4 million gain
$0.1 million gain
$1.6 million loss
$1.4 million loss
$1.7 million loss
2Q23
Yield on Investments (%)
Realized Gains/Losses
2.55%
Investment Portfolio Gains / Losses
Unrealized Losses
▪ Net unrealized AFS Loss of $382.8 million ($269.8 M prior Q)
▪ Net unrealized HTM Loss of $472.6 million ($ 359.7 M prior Q)
$3.7
3Q23
10View entire presentation