Credit Suisse Investment Banking Pitch Book
CONFIDENTIAL
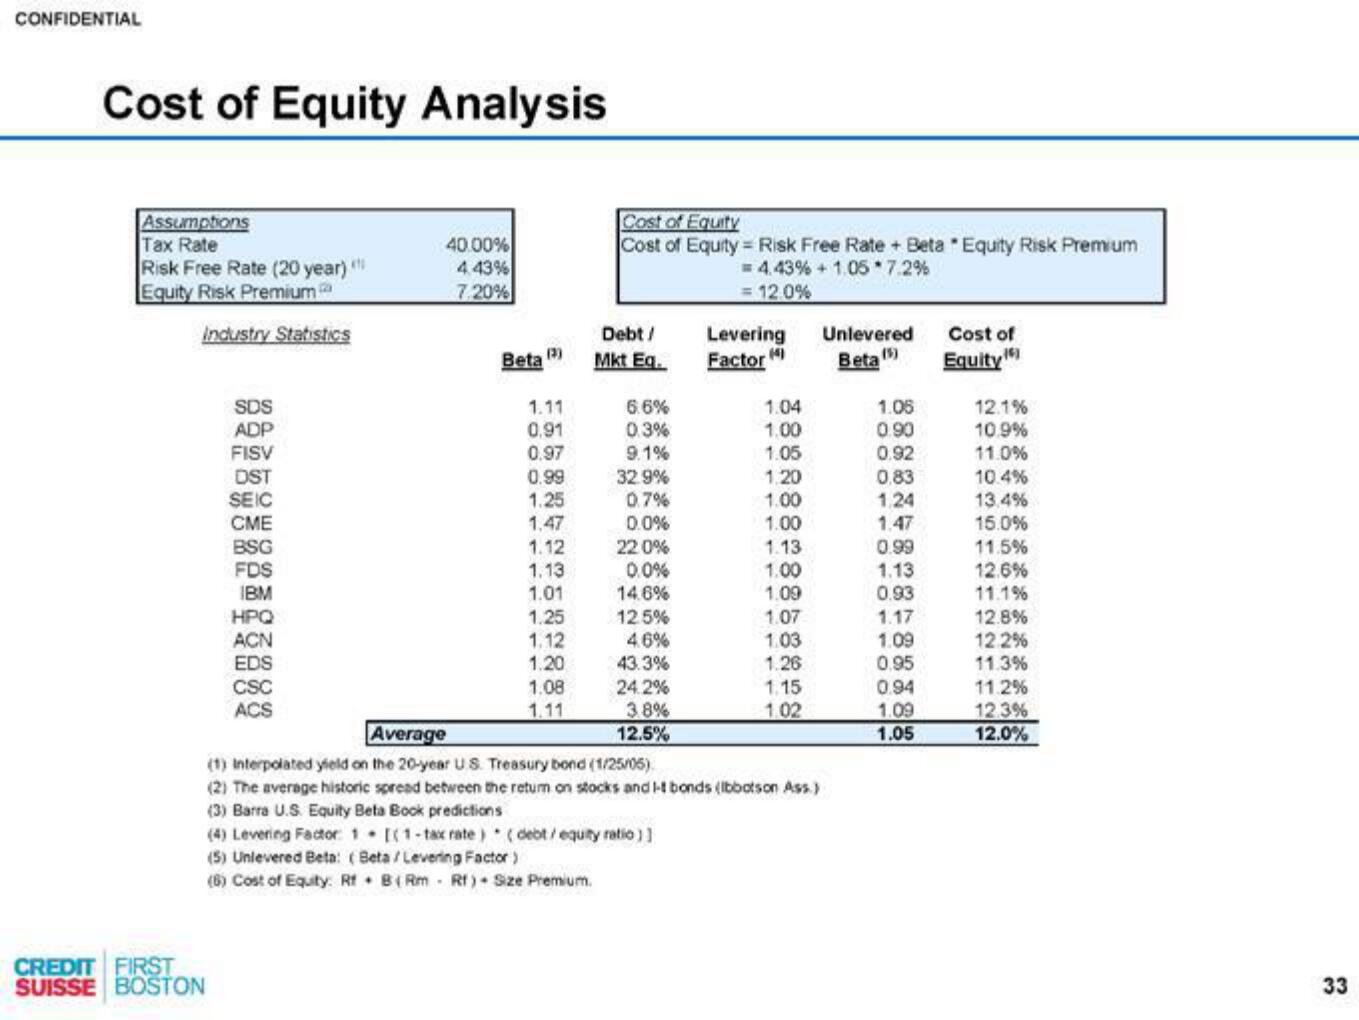
Cost of Equity Analysis
Assumptions
Tax Rate
Risk Free Rate (20 year) KTO
Equity Risk Premium
Industry Statistics
CREDIT FIRST
SUISSE BOSTON
SDS
ADP
FISV
DST
SEIC
CME
BSG
FDS
IBM
HPQ
ACN
EDS
CSC
ACS
40.00%
4.43%
7.20%
Beta
(3)
1.11
0.91
0.97
0.99
1.25
1.47
1.12
1.13
1.01
1.25
1.12
1.20
1.08
1.11
Cost of Equity
Cost of Equity
Debt/
Mkt Eq.
6.6%
0.3%
9.1%
32.9%
0.7%
0.0%
22 0%
0.0%
14.6%
12.5%
4.6%
43.3%
24.2%
3.8%
12.5%
Risk Free Rate + Beta "Equity Risk Premium
= 4.43% + 1.05*7.2%
= 12.0%
(4) Levering Factor: 1 [(1-tax rate) (debt/equity ratio)]
(5) Unlevered Beta: (Beta/Levering Factor)
(6) Cost of Equity: Rf B(Rm Rf) - Size Premium.
Levering
Factor
1.04
1.00
1.05
1.20
1.00
1.00
1.13
1.00
1.09
1.07
1.03
1.26
1.15
1.02
Average
(1) Interpolated yield on the 20-year US. Treasury bond (1/25/05)
(2) The average historic spread between the return on stocks and I-t bonds (Ibbotson Ass.)
(3) Barra U.S. Equity Beta Bock predictions
Unlevered
Beta
1.05
0.90
0.92
0.83
1,24
1.47
0.99
1.13
0.93
1.17
1.09
0.95
0.94
1.09
1.05
Cost of
Equity
12.1%
10.9%
11.0%
10.4%
13.4%
15.0%
11.5%
12.6%
11.1%
12.8%
12.2%
11.3%
11.2%
12.3%
12.0%
33View entire presentation