Endeavour Mining Investor Presentation Deck
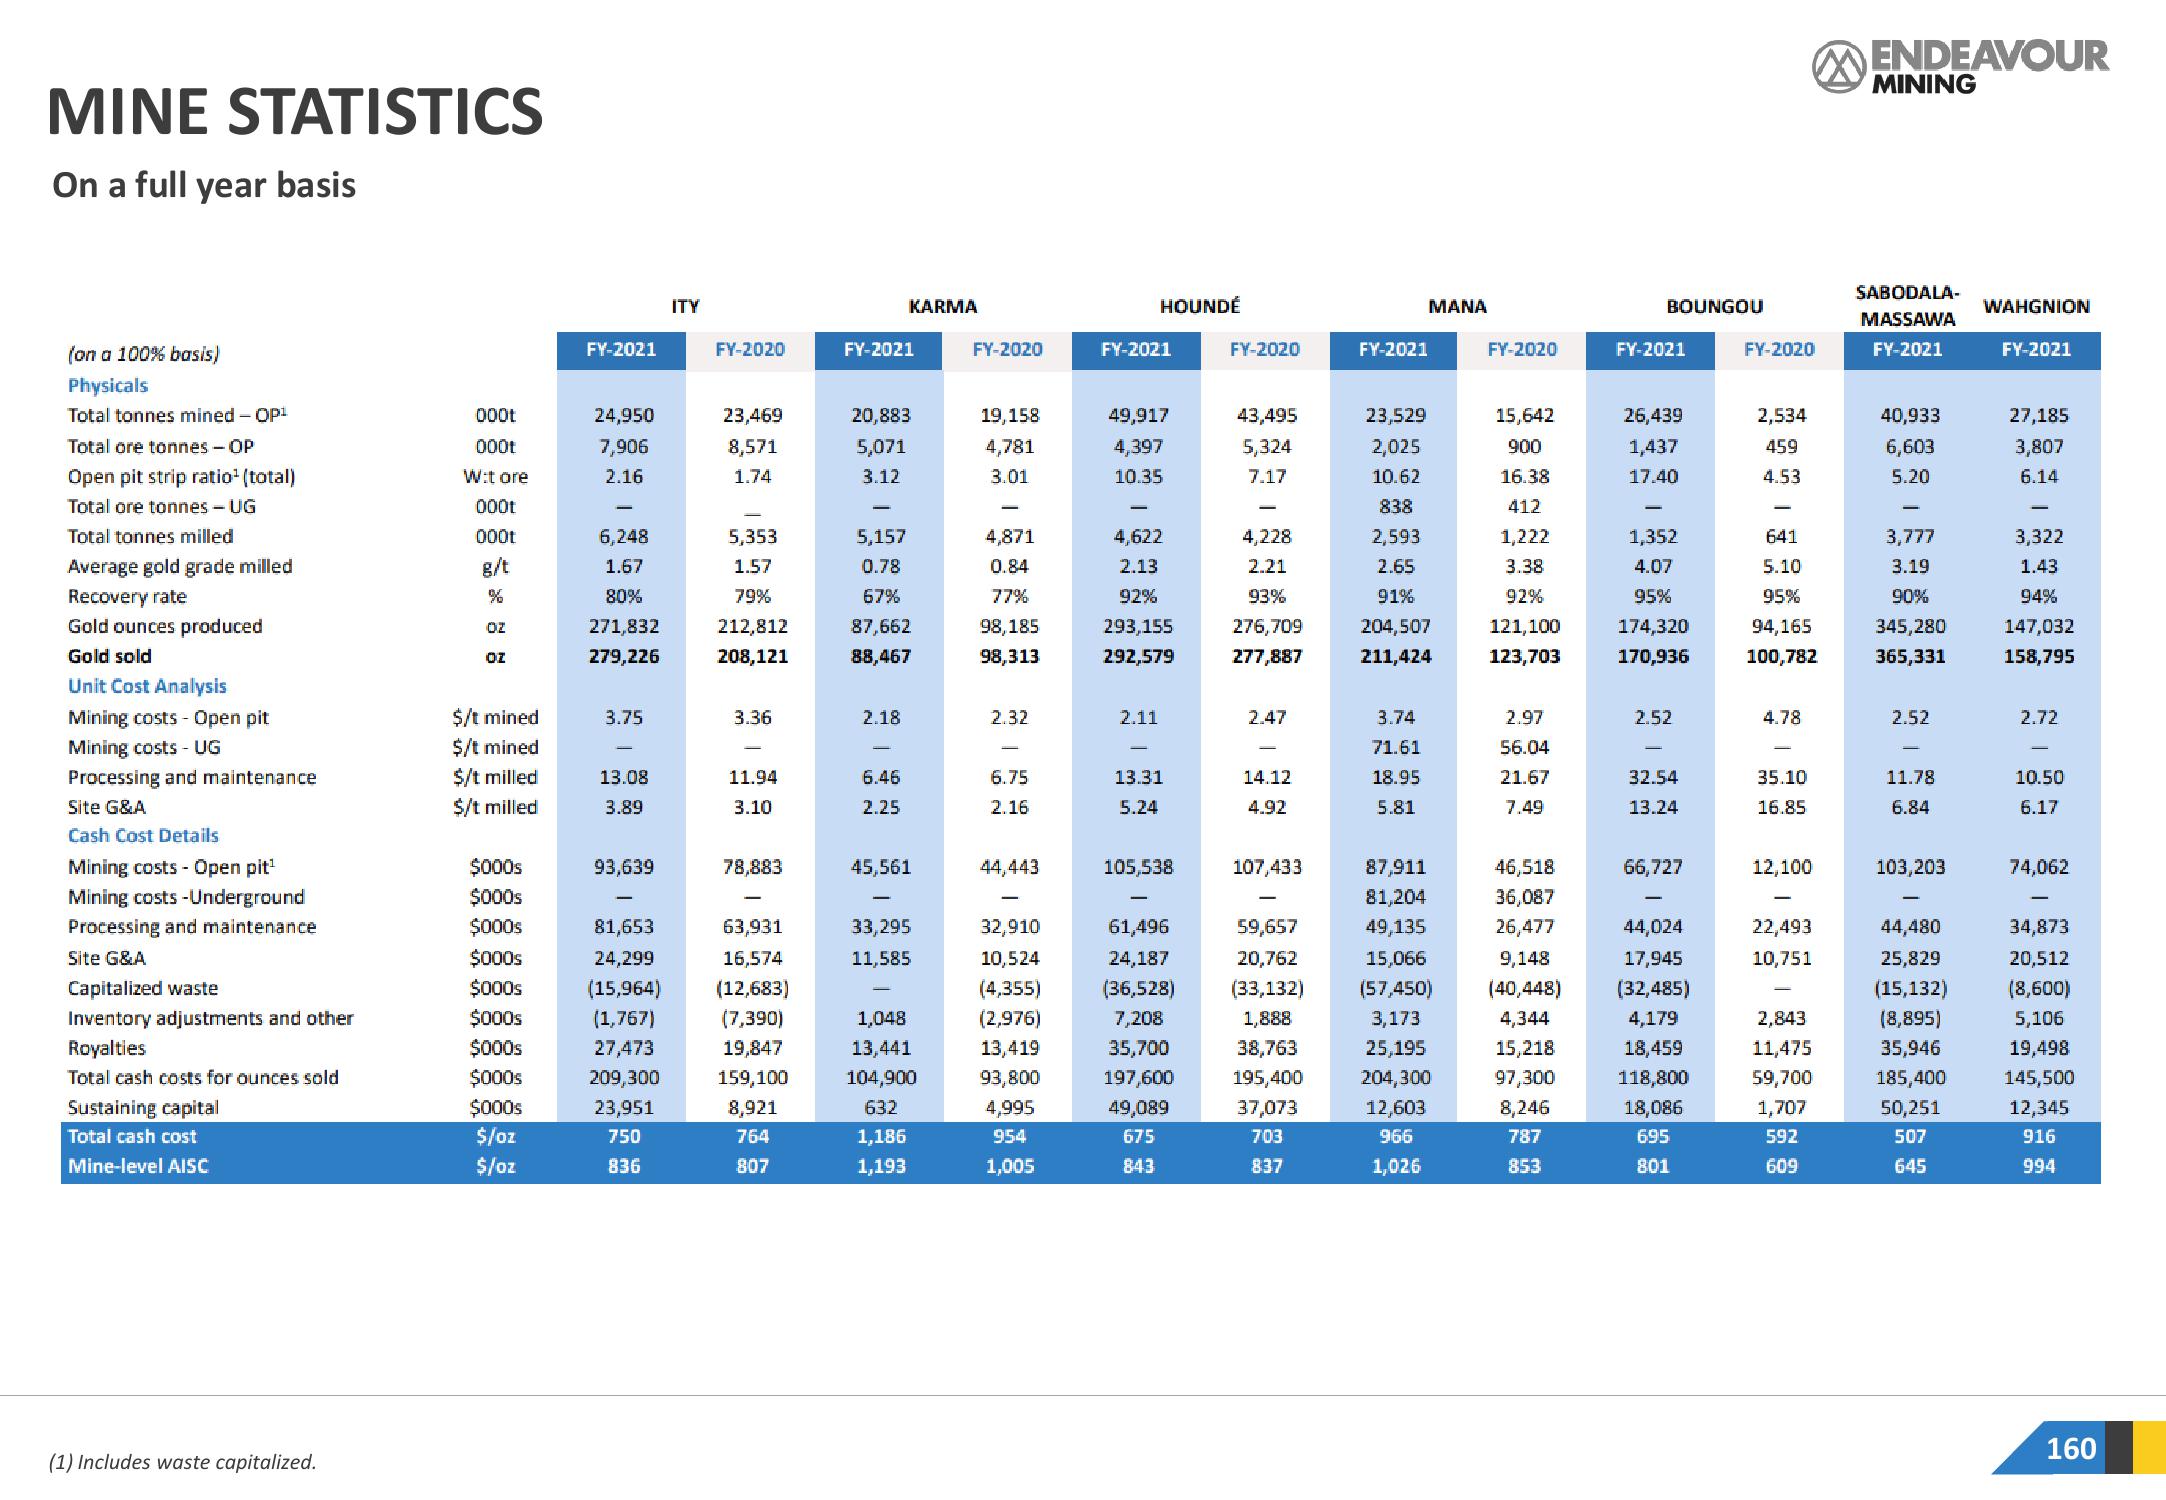
MINE STATISTICS
On a full year basis
(on a 100% basis)
Physicals
Total tonnes mined - OP¹
Total ore tonnes - OP
Open pit strip ratio¹ (total)
Total ore tonnes - UG
Total tonnes milled
Average gold grade milled
Recovery rate
Gold ounces produced
Gold sold
Unit Cost Analysis
Mining costs - Open pit
Mining costs - UG
Processing and maintenance
Site G&A
Cash Cost Details
Mining costs - Open pit¹
Mining costs -Underground
Processing and maintenance
Site G&A
Capitalized waste
Inventory adjustments and other
Royalties
Total cash costs for ounces sold
Sustaining capital
Total cash cost
Mine-level AISC
(1) Includes waste capitalized.
000t
000t
W:t ore
000t
000t
%
OZ
OZ
$/t mined
$/t mined
$/t milled
$/t milled
$000s
$000s
$000s
$000s
$000s
$000s
$000s
$000s
$000s
$/oz
$/oz
FY-2021
24,950
7,906
2.16
6,248
1.67
80%
271,832
279,226
3.75
13.08
3.89
93,639
81,653
24,299
(15,964)
(1,767)
27,473
209,300
23,951
750
836
ITY
FY-2020
23,469
8,571
1.74
5,353
1.57
79%
212,812
208,121
3.36
11.94
3.10
78,883
63,931
16,574
(12,683)
(7,390)
19,847
159,100
8,921
764
807
FY-2021
20,883
5,071
3.12
5,157
0.78
KARMA
67%
87,662
88,467
2.18
6.46
2.25
45,561
33,295
11,585
1,048
13,441
104,900
632
1,186
1,193
FY-2020
19,158
4,781
3.01
4,871
0.84
77%
98,185
98,313
2.32
6.75
2.16
44,443
32,910
10,524
(4,355)
(2,976)
13,419
93,800
4,995
954
1,005
HOUNDÉ
FY-2021
49,917
4,397
10.35
4,622
2.13
92%
293,155
292,579
2.11
13.31
5.24
105,538
61,496
24,187
(36,528)
7,208
35,700
197,600
49,089
675
843
FY-2020
43,495
5,324
7.17
4,228
2.21
93%
276,709
277,887
2.47
14.12
4.92
107,433
59,657
20,762
(33,132)
1,888
38,763
195,400
37,073
703
837
FY-2021
23,529
2,025
10.62
838
2,593
2.65
91%
204,507
211,424
3.74
71.61
18.95
5.81
MANA
87,911
81,204
49,135
15,066
(57,450)
3,173
25,195
204,300
12,603
966
1,026
FY-2020
15,642
900
16.38
412
1,222
3.38
92%
121,100
123,703
2.97
56.04
21.67
7.49
46,518
36,087
26,477
9,148
(40,448)
4,344
15,218
97,300
8,246
787
853
BOUNGOU
FY-2021
26,439
1,437
17.40
1,352
4.07
95%
174,320
170,936
2.52
32.54
13.24
66,727
44,024
17,945
(32,485)
4,179
18,459
118,800
18,086
695
801
FY-2020
2,534
459
4.53
641
5.10
95%
94,165
100,782
4.78
35.10
16.85
12,100
22,493
10,751
2,843
11,475
59,700
1,707
592
609
ENDEAVOUR
MINING
SABODALA-
MASSAWA
FY-2021
40,933
6,603
5.20
3,777
3.19
90%
345,280
365,331
2.52
11.78
6.84
103,203
44,480
25,829
(15,132)
(8,895)
35,946
185,400
50,251
507
645
WAHGNION
FY-2021
27,185
3,807
6.14
3,322
1.43
94%
147,032
158,795
2.72
10.50
6.17
74,062
34,873
20,512
(8,600)
5,106
19,498
145,500
12,345
916
994
160View entire presentation