Strategically Positioning Truist Insurance Holdings for Long-Term Success
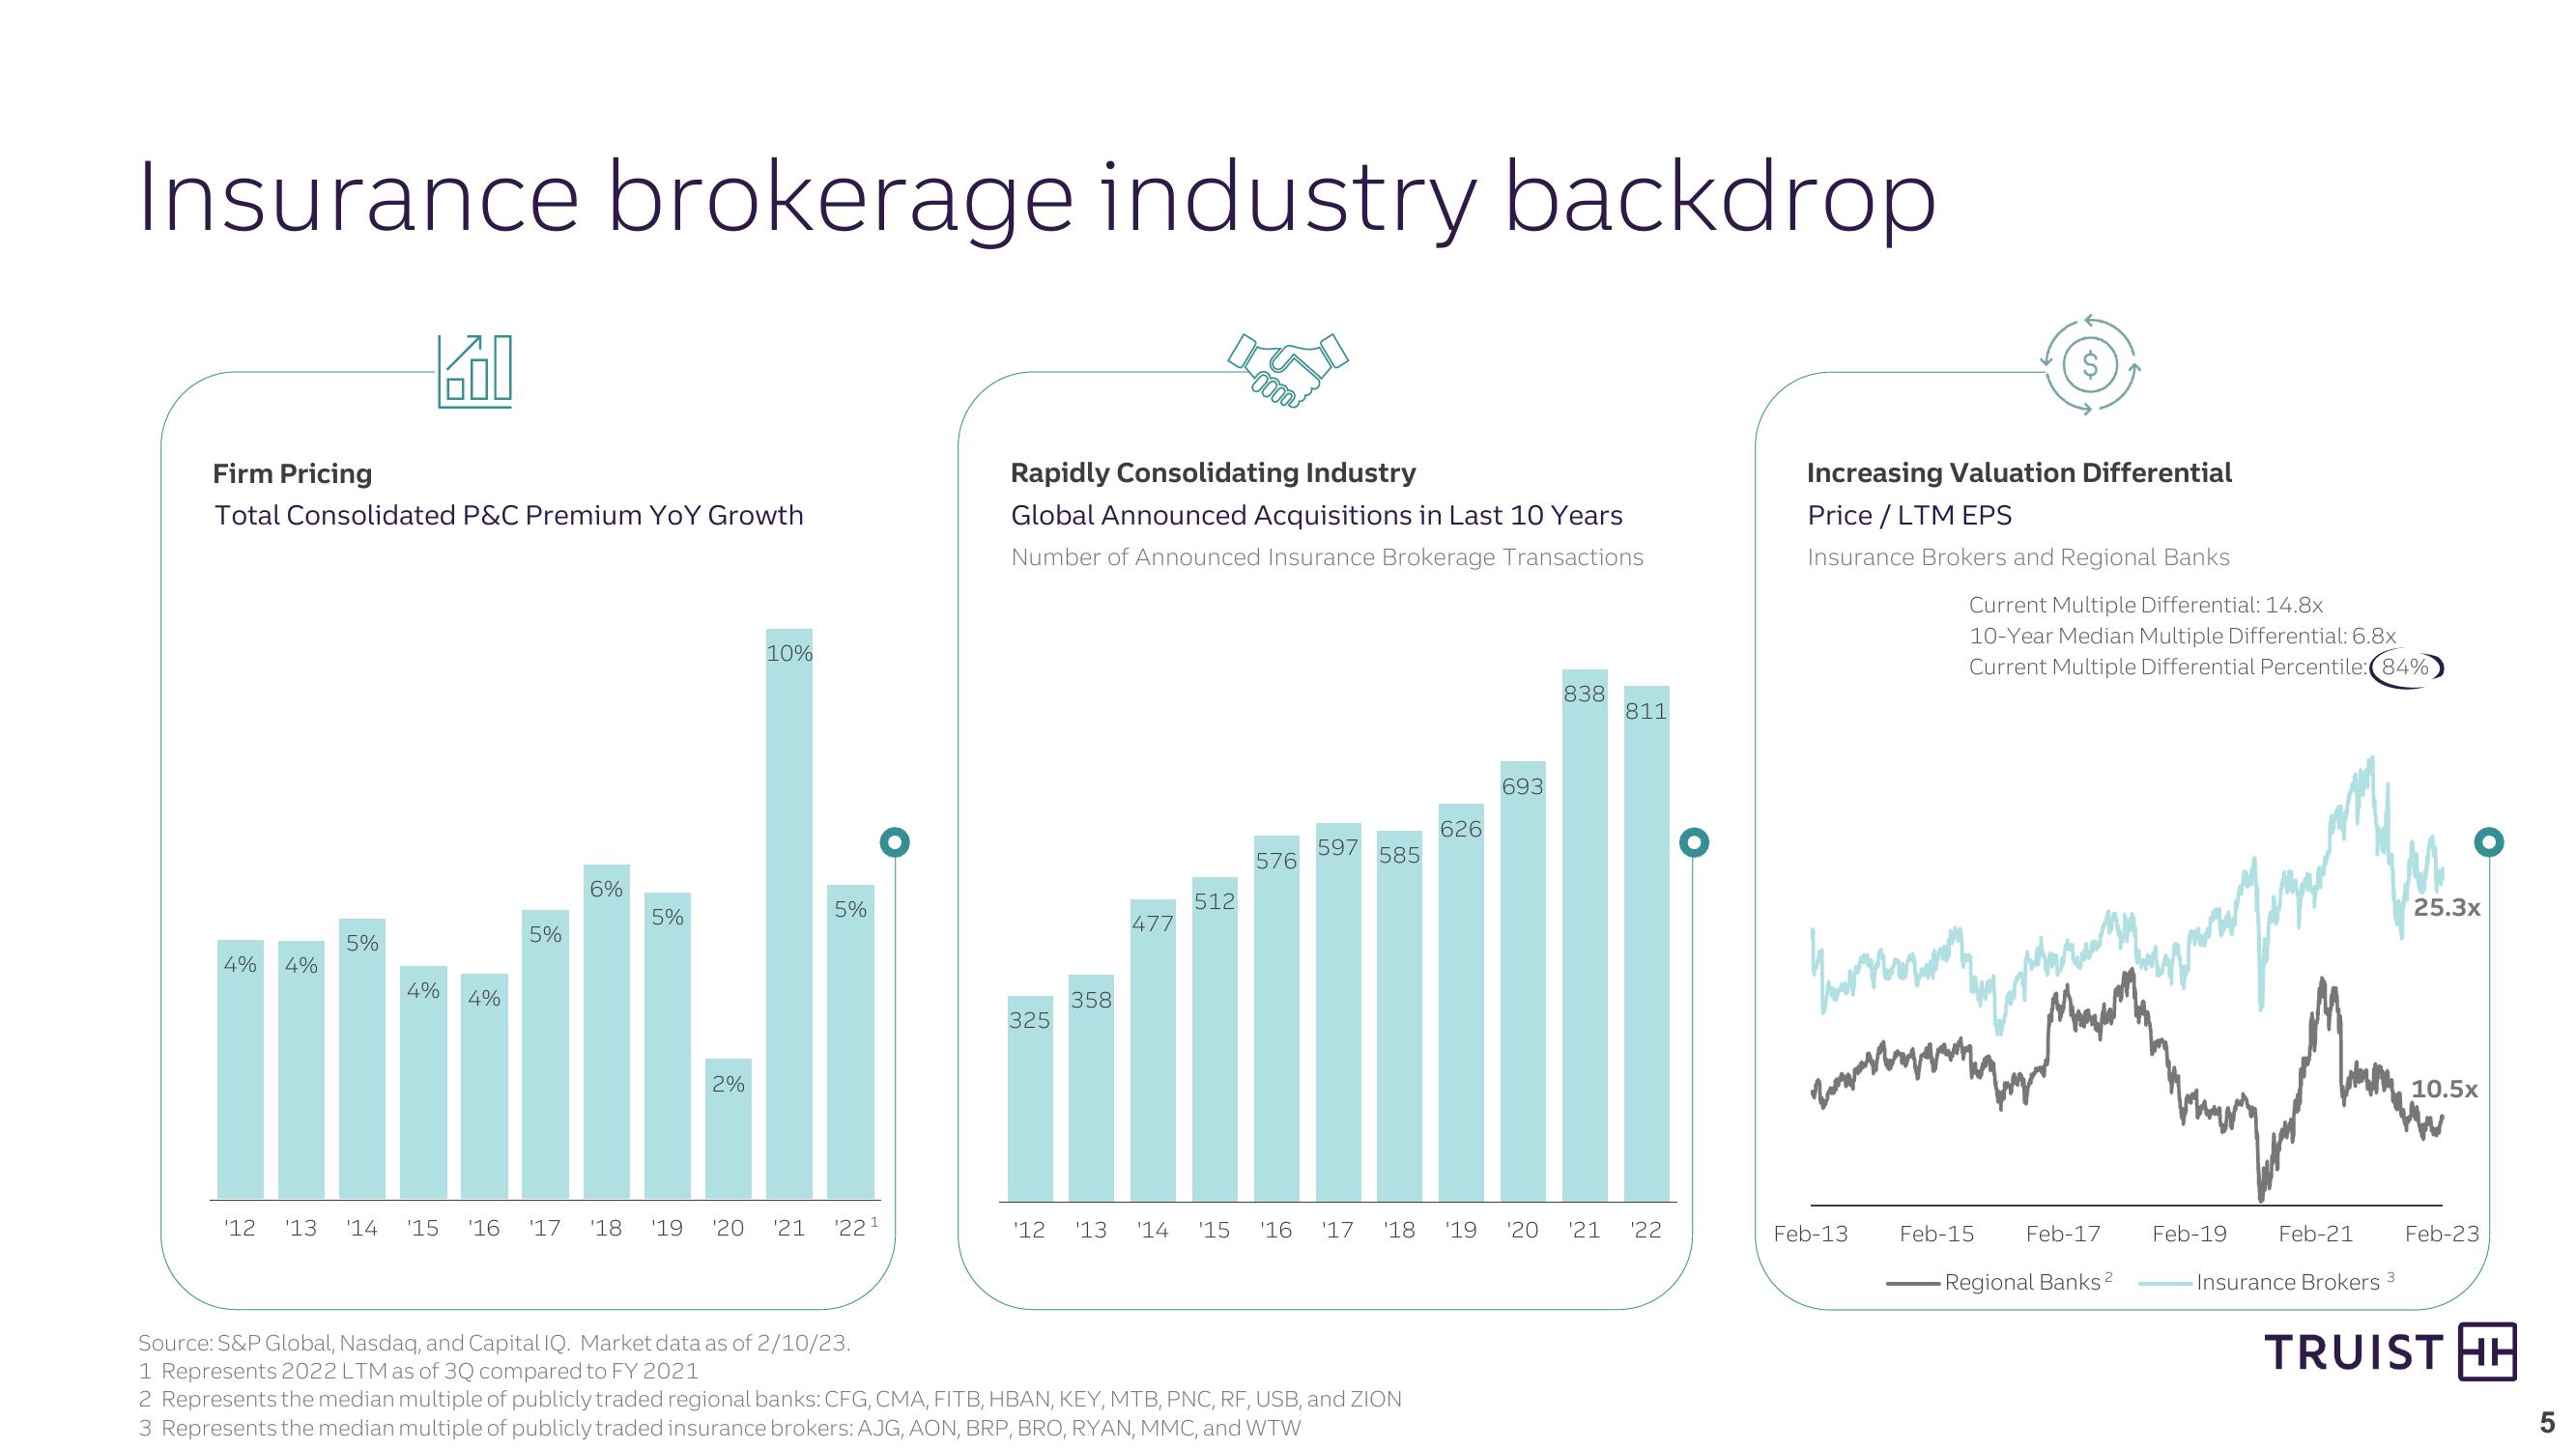
Insurance brokerage industry backdrop
Firm Pricing
Total Consolidated P&C Premium YoY Growth
10%
Rapidly Consolidating Industry
Global Announced Acquisitions in Last 10 Years
Number of Announced Insurance Brokerage Transactions
Increasing Valuation Differential
Price/LTM EPS
Insurance Brokers and Regional Banks
Current Multiple Differential: 14.8x
10-Year Median Multiple Differential: 6.8x
Current Multiple Differential Percentile: (84%
5%
5%
4% 4%
4% 4%
6%
5%
5%
2%
358
325
693
626
597
576
585
512
477
838
811
'12 '13
'14 '15
'16 '17
'18 '19
'20 '21
'221
'12
13
'14
'15 '16 '17
'18
'19 '20
'21
'22
Feb-13
Feb-15
Feb-17
Feb-19
Regional Banks 2
Source: S&P Global, Nasdaq, and Capital IQ. Market data as of 2/10/23.
1 Represents 2022 LTM as of 3Q compared to FY 2021
2 Represents the median multiple of publicly traded regional banks: CFG, CMA, FITB, HBAN, KEY, MTB, PNC, RF, USB, and ZION
3 Represents the median multiple of publicly traded insurance brokers: AJG, AON, BRP, BRO, RYAN, MMC, and WTW
Feb-21
25.3x
10.5x
ww
Feb-23
Insurance Brokers 3
TRUIST HH
5View entire presentation