Livent Corporation Investor Presentation
Livent
Company Snapshot
Livent has been an independent publicly traded company since its IPO on October 11, 2018
Low Cost
Cost leadership in Lithium Carbonate, Lithium Hydroxide and
Lithium Chloride
Global Footprint
Encompassing 6 manufacturing and sourcing sites across 5
countries supported by ~1,350 employees
Lithium
Carbonate &
Lithium
Chloride
9%
(1)
3
Revenue by Product ³
Butyllithium
34%
Other
Specialty
6%
Lithium
Hydroxide
51%
Other
6 %
Synthesis
10 %
Greases
13%
Revenue by Application ³,4
Polymers
26%
Adjusted EBITDA²
2022 Total
$813mm
1
($ million) 2023E
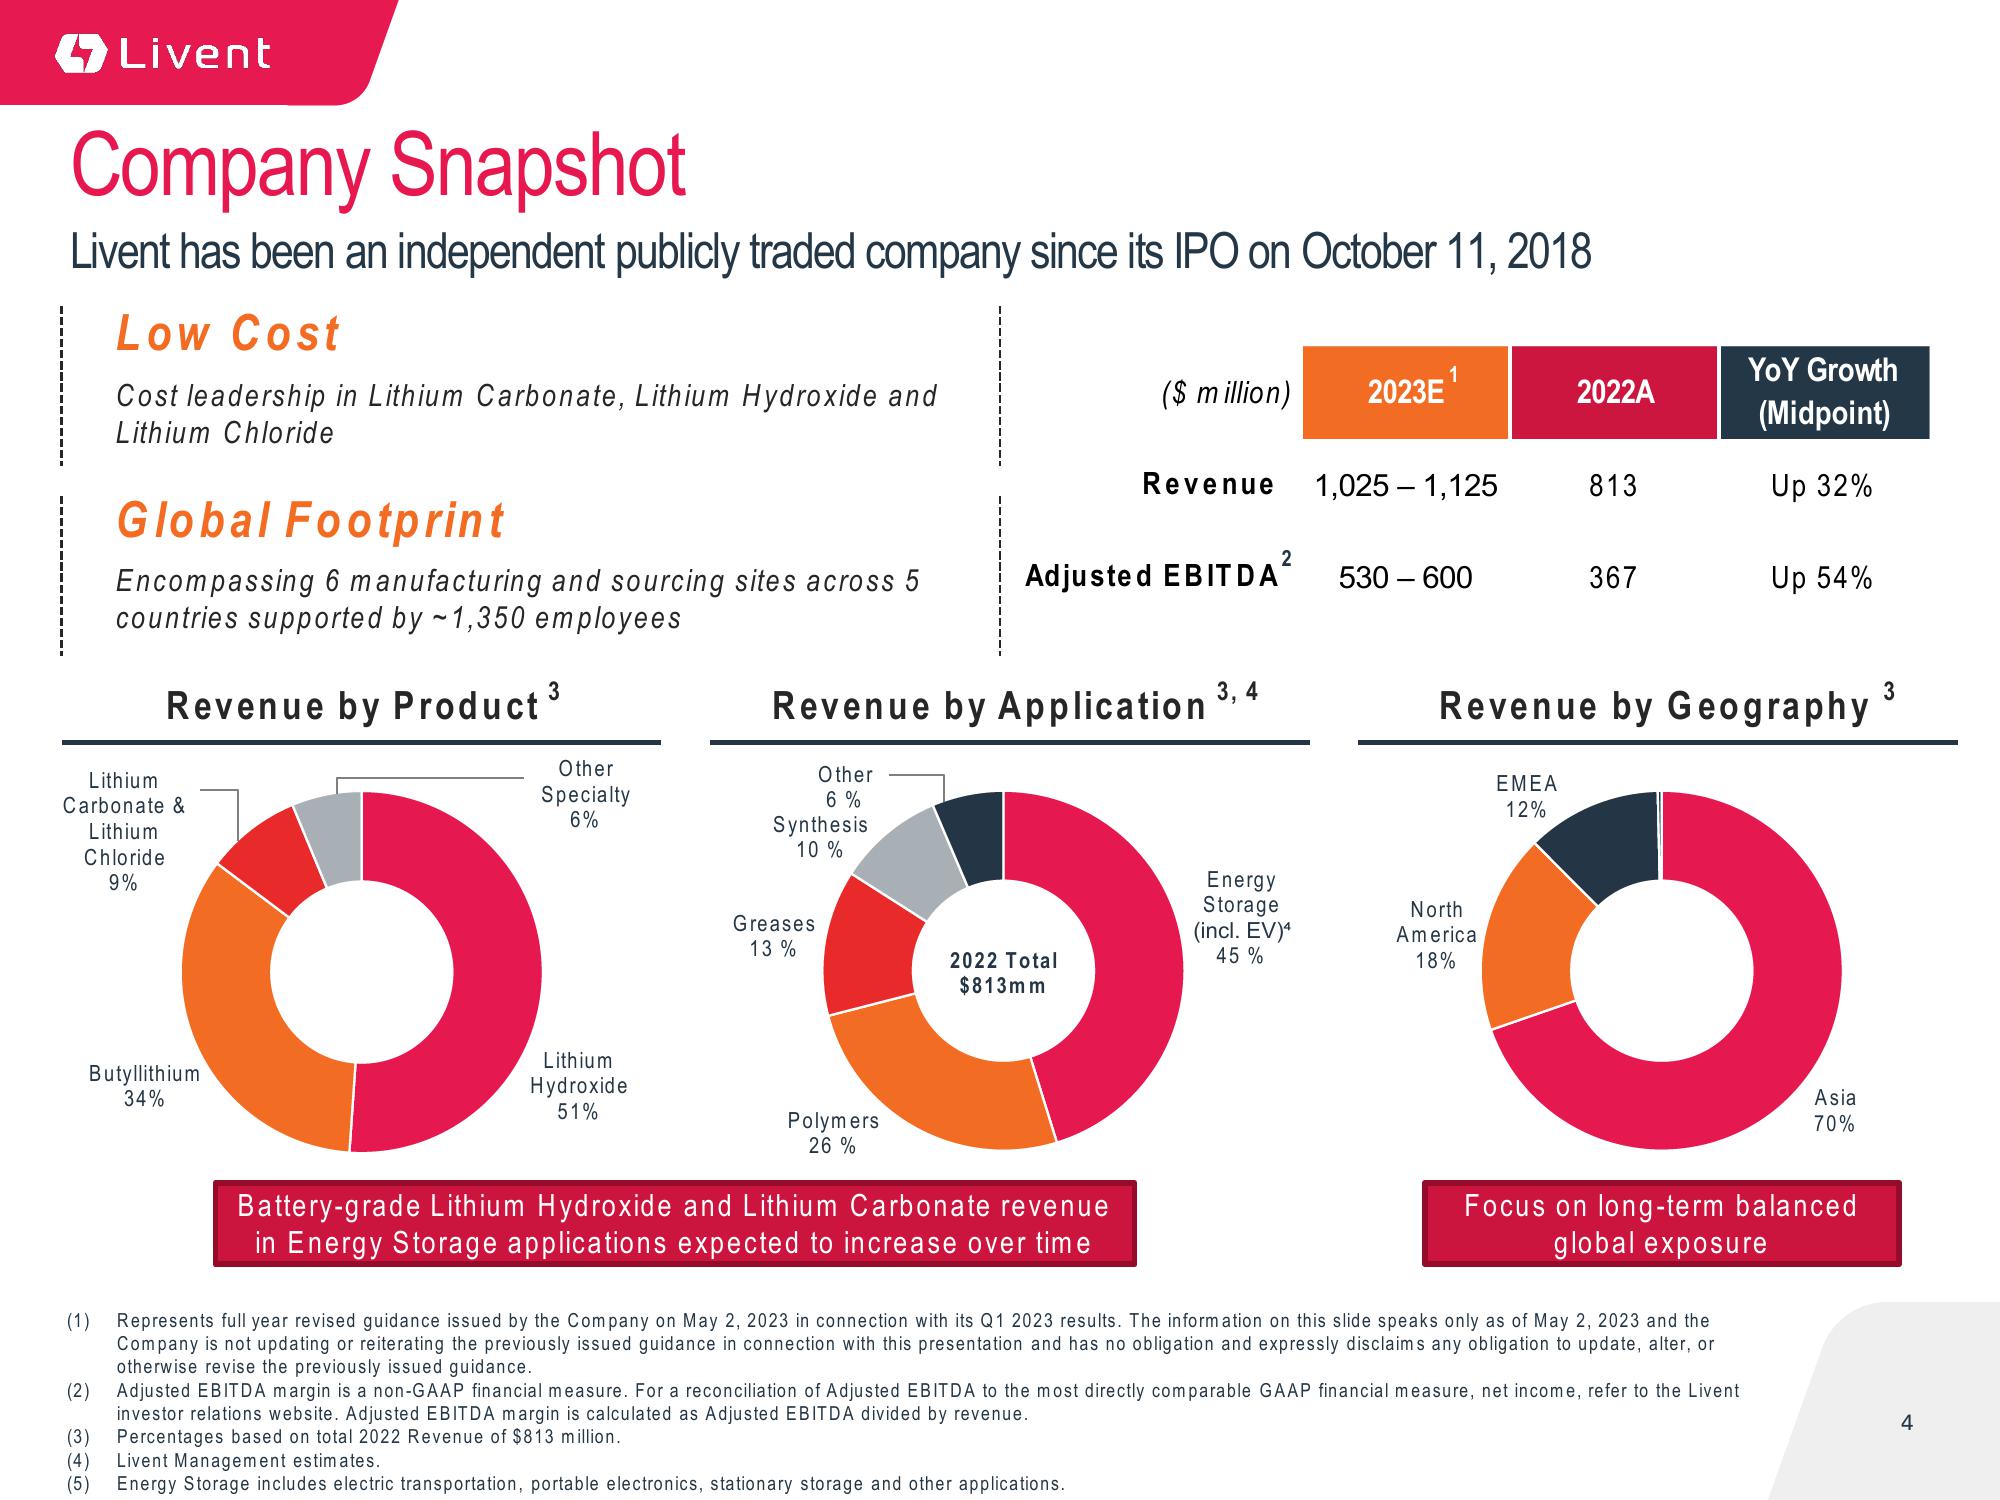
Battery-grade Lithium Hydroxide and Lithium Carbonate revenue
in Energy Storage applications expected to increase over time
Revenue
(4) Livent Management estimates.
(5) Energy Storage includes electric transportation, portable electronics, stationary storage and other applications.
Energy
Storage
(incl. EV)4
45%
1,025 - 1,125
530 - 600
2022A
North
America
18%
813
367
Revenue by Geography
EMEA
12%
Represents full year revised guidance issued by the Company on May 2, 2023 in connection with its Q1 2023 results. The information on this slide speaks only as of May 2, 2023 and the
Company is not updating or reiterating the previously issued guidance in connection with this presentation and has no obligation and expressly disclaims any obligation to update, alter, or
otherwise revise the previously issued guidance.
YOY Growth
(Midpoint)
Up 32%
(2) Adjusted EBITDA margin is a non-GAAP financial measure. For a reconciliation of Adjusted EBITDA to the most directly comparable GAAP financial measure, net income, refer to the Livent
investor relations website. Adjusted EBITDA margin is calculated as Adjusted EBITDA divided by revenue.
(3) Percentages based on total 2022 Revenue of $813 million.
Up 54%
Focus on long-term balanced
global exposure
Asia
70%
3
4View entire presentation