Rover Investor Update
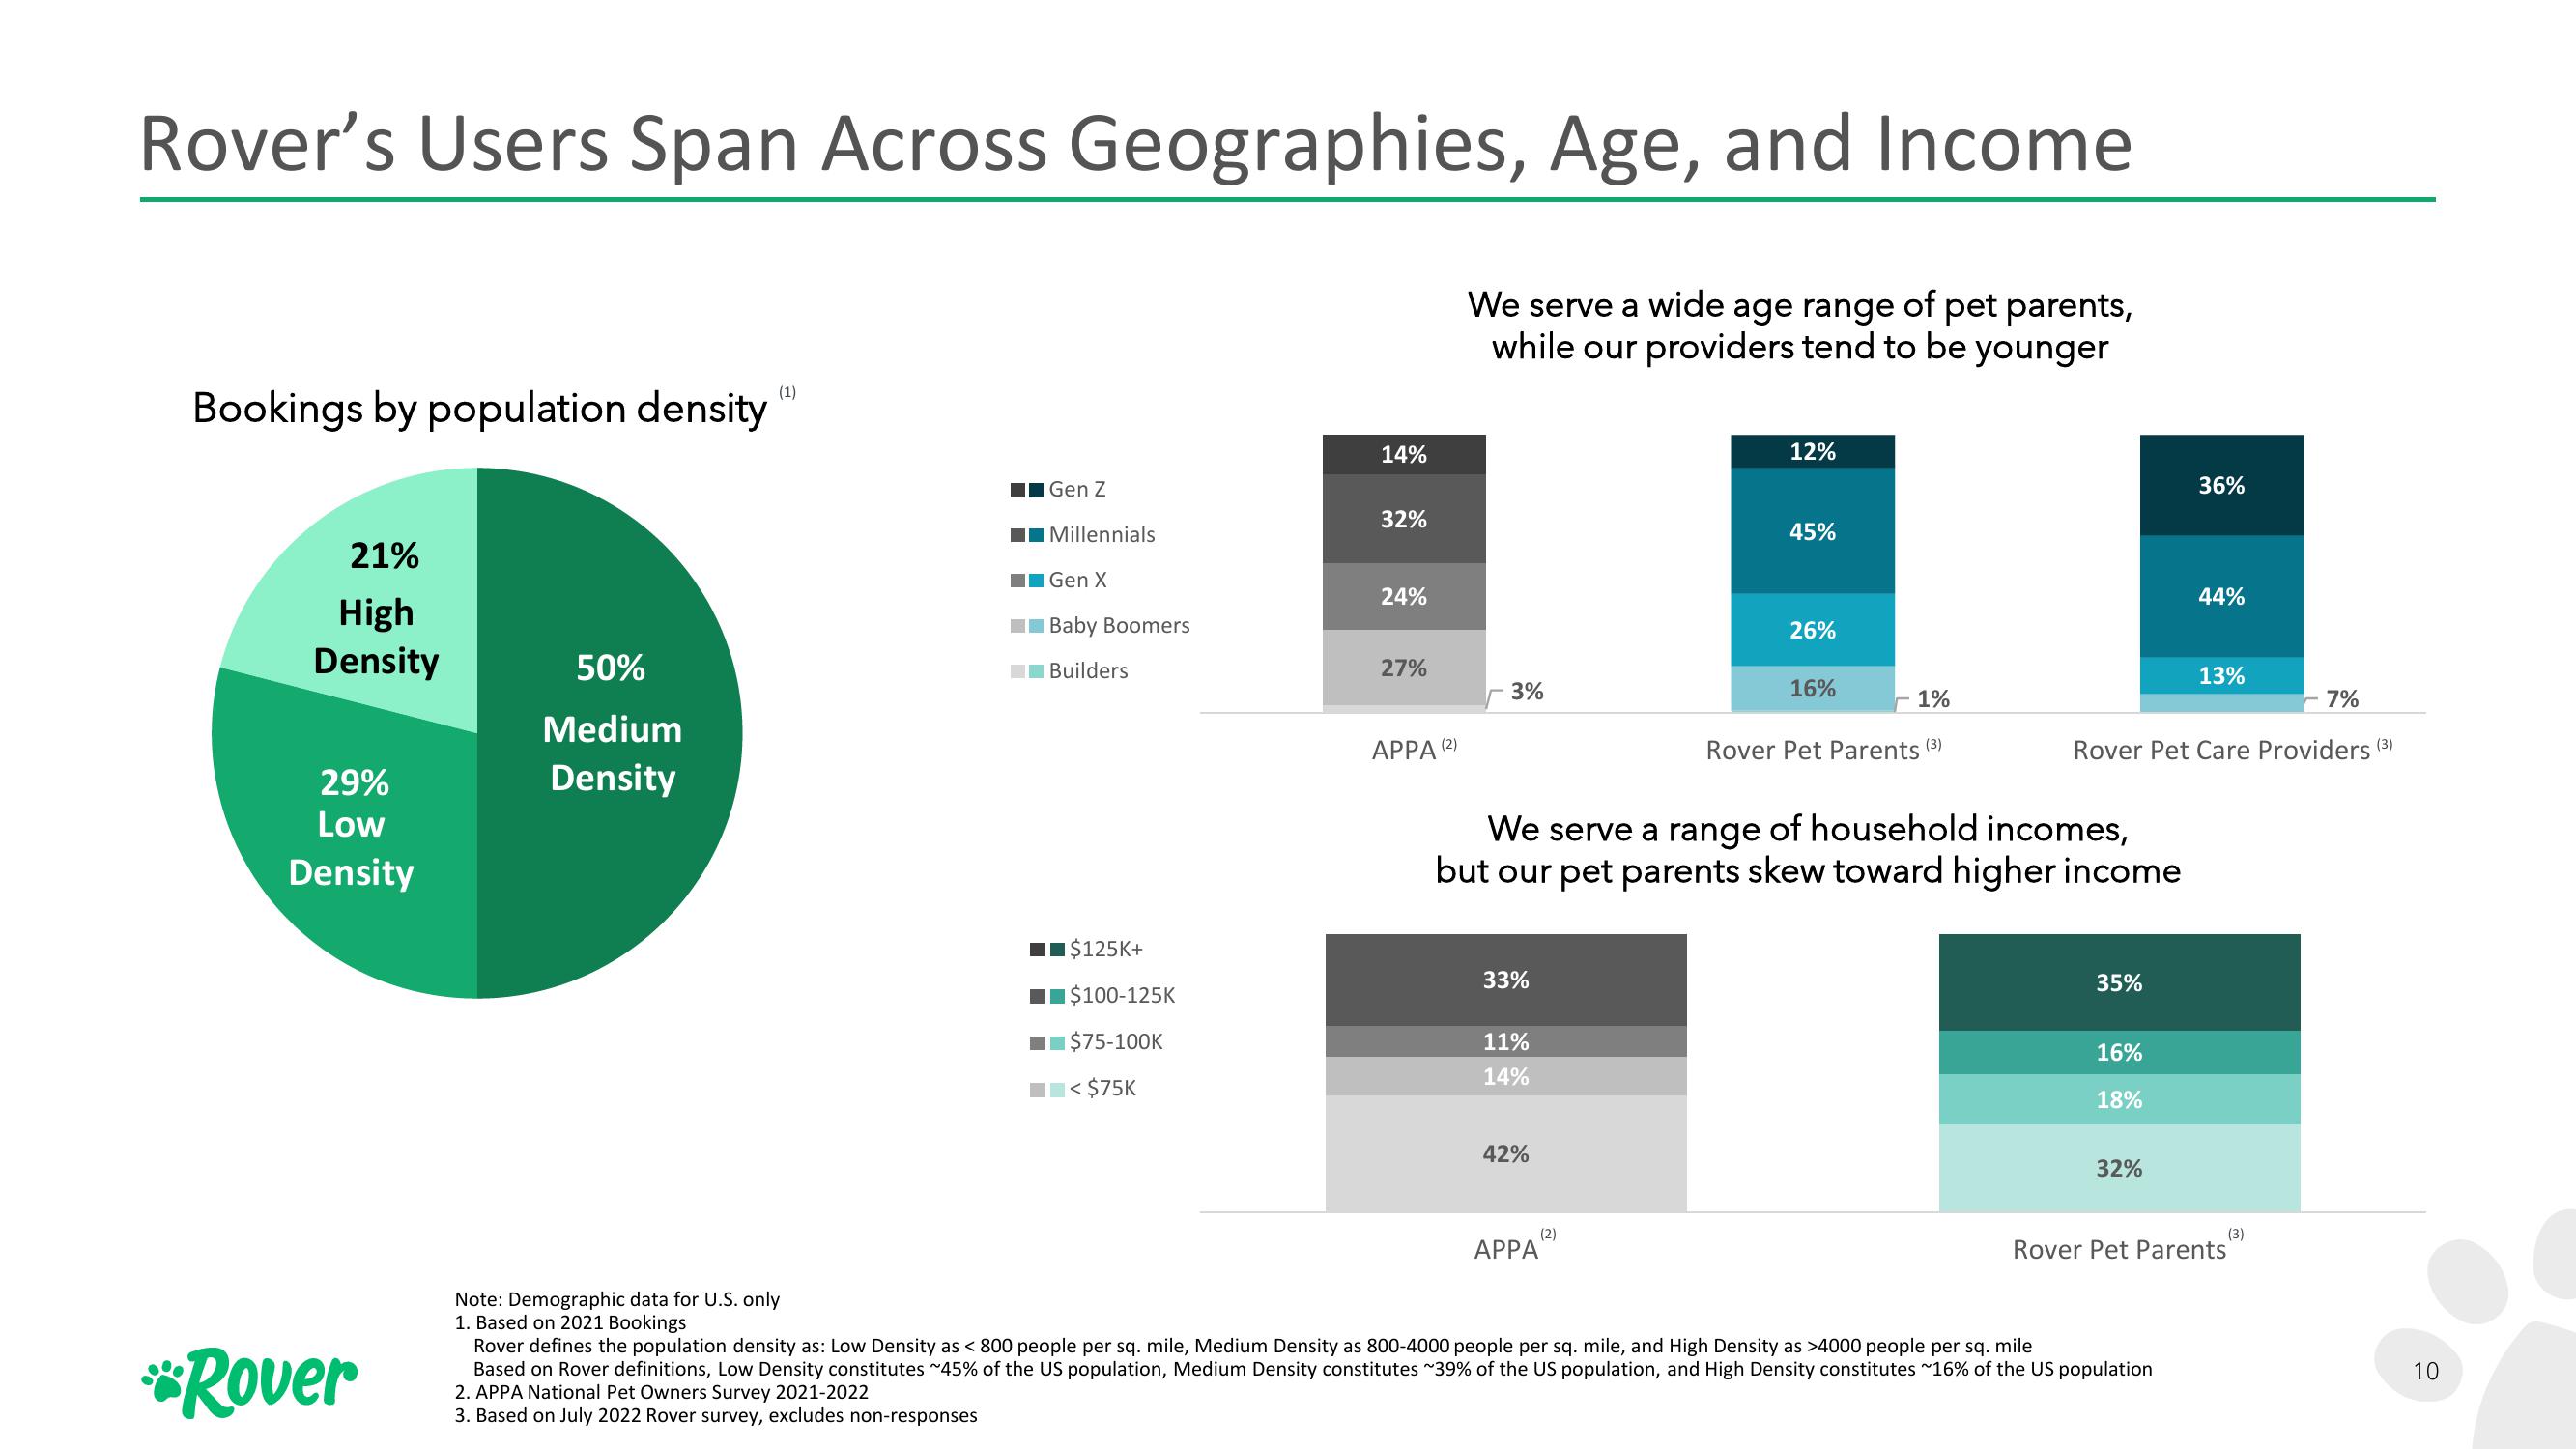
Rover's Users Span Across Geographies, Age, and Income
We serve a wide age range of pet parents,
while our providers tend to be younger
Bookings by population density
21%
High
Density
29%
Low
Density
*Rover
50%
Medium
Density
(1)
Gen Z
Millennials
Gen X
Baby Boomers
Builders
☐☐$125K+
$100-125K
$75-100K
< $75K
14%
32%
24%
27%
APPA (2)
3%
33%
11%
14%
42%
APPA
12%
(2)
45%
We serve a range of household incomes,
but our pet parents skew toward higher income
26%
16%
- 1%
Rover Pet Parents (³)
35%
16%
18%
Rover Pet Care Providers (³)
32%
36%
44%
Note: Demographic data for U.S. only
1. Based on 2021 Bookings
Rover defines the population density as: Low Density as < 800 people per sq. mile, Medium Density as 800-4000 people per sq. mile, and High Density as >4000 people per sq. mile
Based on Rover definitions, Low Density constitutes ~45% of the US population, Medium Density constitutes ~39% of the US population, and High Density constitutes ~16% of the US population
2. APPA National Pet Owners Survey 2021-2022
3. Based on July 2022 Rover survey, excludes non-responses
13%
(3)
Rover Pet Parents
7%
10View entire presentation